Am I using correct comparision to real world visual, is incoherent or coherent better?

  • 31 May 2021
  • 3 replies
  • 132 views


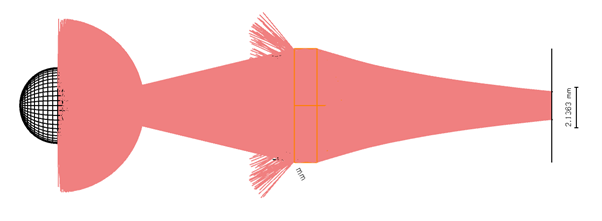
Hi, so I am modelling a simple RED LED and planar convex lens and trying to get it to focus on a detector. I'm am doing this as an exercise to compare to real world results and gain some understanding.


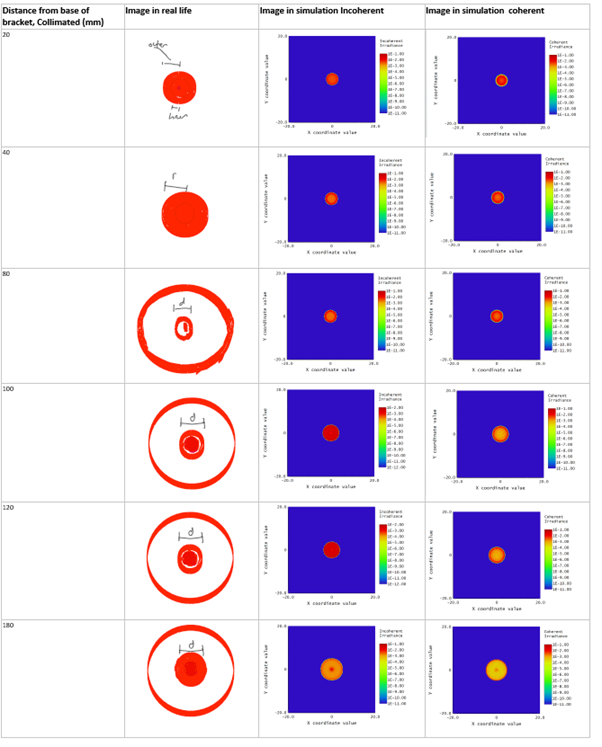
Distance from base of bracket, Collimated (mm)


Real Radius


Sim Radius


20


3 (inner)


2.6 (inner)


20


4-5 (outer)


8.9 (outer)


80


3.45


-


100


4.9


3.5


120


4.9


3.7


180


5.4


4.7


So the tables above shows comparison of real world observations vs. simulation ones ( I have attached a image of the visual comparisions, sketches only rough and light tends to fade in outer rings).  Both visual and measured. I would assume the difference in measured radius would  be due to inaccuracies/differences in in the physical setup (my setup is quite simple). The trends seem similar. However I am concerned about the additional rings of light visible in real world. I cannot explain these. I am most worried about extra light lost that is not modelled, but would also just like to understand.


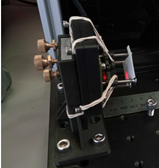
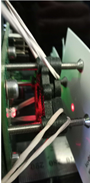
I have also attached images of setup and simulations.


Am I using correct comparision to real world visual, is incoherent or coherent better?


Other concerns:


Is modelling a more accurate wavelength spectrum worthwhile, I am currently using a single wavelength?


I am currently using non-sequential, is this best?

picture1.pngpicture2.pngpicture3.pngpicture4.png

3 replies

Userlevel 7
Badge +3

Hi Jonathan,


Yes, NS is the best mode to use for this. Three things to check:


1. The LED model. You need both angular and spatial data for accurate results. Best is a ray-set based on measured data. You don't say what source you're using, so this is job #1. As you get a dark ring in real life, this suggests a dip in the angular perfromance of the LED.


2. The Detectors on NS mode are perfectly linear. Make sure you understand any difference between that and what your experimental detector does.


3. Make sure you're clear what criterion you're using to give a single number for spot size. It's best to use RMS spot size, and that is set by the aggregate performance of all rays. If you go off of maximum size, outlier rays determine the result and this gives a noisier result.


HTH,


- Mark 

Hi, thanks for the quick response. Unfortunately I am still not sure if incoherent or coherent in a logrithmic scale as I have used is a appropriate representation of what pattern I could reasonably expect to see projected onto a piece of  card at a set distance?


In response to your points:


1. So the source is a IESNA file of the angular distribution of red LED. I do not think this includes spatial data (Don't think this is availible). Could that explain the pattern difference? The below image is of a polar distribtion from spherical detector around source:


2. I have experimented with logrithmic and linear as it is an option for the plot of detector. But I am struggling with understanding, especially within relation to real world.


3. I've just been getting a rough idea of size off the plot as I don't suspect my tools are accurate enough in the realworld anyway. Would a merit function NSDD of spot size be the easiest way to read RMS spot size?


Userlevel 3
Badge +4

If you want to know which is applicable, you should consider studying the Van Cittert-Zernike theorem:  https://en.wikipedia.org/wiki/Van_Cittert%E2%80%93Zernike_theorem


Sources can be temporally incoherent (e.g. broadband like an LED or even a star) and still be spatially coherent.  In which case, coherent effects can make a difference. 


Coherent ray tracing in non-sequential mode can be quite tricky.  What is the reason you are using a non-sequential model?


Reply