YZ view for POP simulation

  • 14 August 2023
  • 5 replies
  • 180 views

Userlevel 6
Badge +2

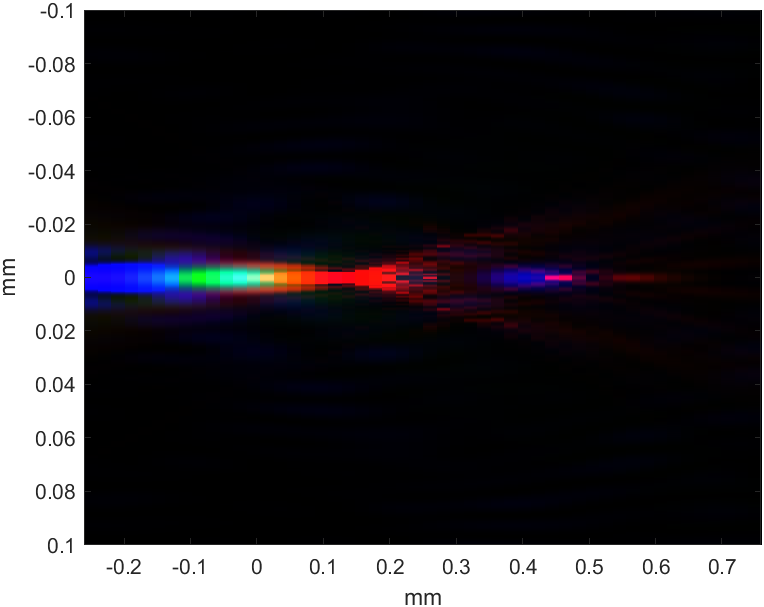
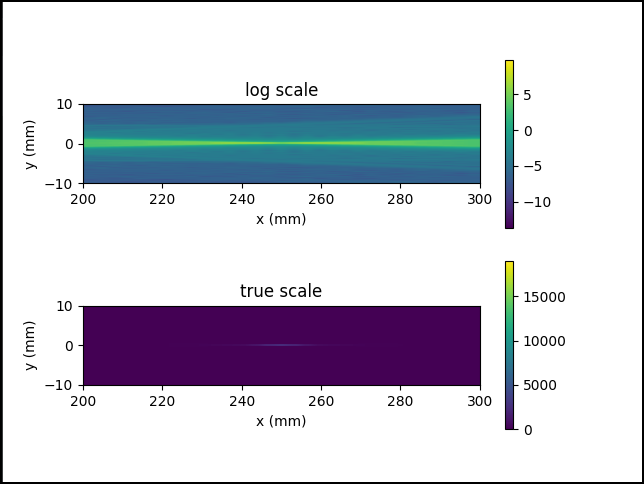
Attached python script loads a ZBF and propagate the beam to a specific range with given sampling. And then draw the beam in YZ view.

Currently POP doesn’t support YZ view, but we can first save a ZBF file and use this tool to show YZ for desired range in z direction.

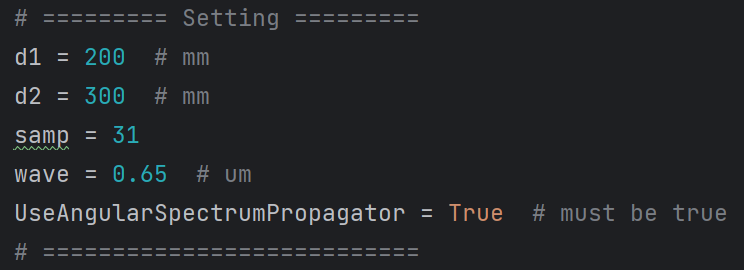
The settings are as below.

  • The beam will be drawn for the range between d1 and d2.
  • We can specify the sampling with the variable samp.
  • The UseAngularSpectrumPropagator must be True for now. We could update it to support False, but this requires some more complicated stitching process.
  • The wave should be correctly set up with the wavelength in the ZBF, otherwise we would get wrong result.


Click here to download

Date Version OpticStudio Version Comment
2023/08/14 1.0 23R2 Creation

5 replies

Userlevel 6
Badge +2

Here is a sample file if we want to test.

Userlevel 3
Badge

Hello @Michael Cheng ,


Thank you for creating this!

I’ve often wanted to simulate a YZ cross section of focus. Your script worked perfectly without any fiddling! Thanks for including the example file.

I did find that d1 and d2 seem to be relative to ‘best focus’. For example, when changing the ‘wave’ variable via the python script the beam shape is updated but there is no offset for chromatic focal shift.

I suspect there is a more elegant way to accomplish this, but I ended up outputting individual beam files from POP for each wavelength of interest and running them individually from your script (with the wave variable commented out). This retained the ‘global’ z position. Here is the fused image for three visible wavelengths.

Thanks again for this awesome tool.

Ps. If try and re-run the script I get a “Failed to initialize pythonnet: System.InvalidOperationException: This property must be set before runtime is initialized” error. If I restart the kernel it works fine. 

Userlevel 6
Badge +2

Hi John,

I’m glad you like the tool and thank you for sharing your nice result!

I agree for different wavelength you probably need to re-run the POP. It’s an interesting question whether we can approximate result for different wavelength from one ZBF. I think the most accurate result should require re-running POP as different wavelength should have different behavior when passing the whole optical system. However, I also agree there might be some tricks to approximate the multi-wavelength result w/o needing to re-run the POP propagation. Although I don’t know what that could be.

I don’t know about the error message either. My guess is when you re-run the script, it’s performed under the same opened kernel, which has some status related to the previous run and affected your next run. This explains why restart the Python kernel works. Just some guess.

Userlevel 3
Badge

Hello @Michael Cheng,

I’ve run into an issue trying to correlate scale/units between the results I see in zemax when generating the beam file and those I get out of the YZview script.

After some trial and error, I’ve discovered that XYZ output has intensities normalized to a peak value of 1 at the nominal (z=0) position.

Ultimately, I’d like to run various beam files and directly compare the intensities. I can manually note and scale the output using the Watts/mm^2 values for each beam file. Do you have any suggestions on how to accomplish this more elegantly? 

edit: I should also add that I’ve configured the analysis to be ‘total power = 1’. I’ve confirmed that the sum of each XY image is a constant. 

Thank you,

John

Userlevel 6
Badge +2

Hi John,

Oh that is a good question I didn’t consider. When you do this manually, you have a button to get the power from the file.  


Fortunately, this button do is available in API. We only need to add one line then this button will be clicked when you specify a ZBF file. :)


Reply