Solved

2D-Vignetting for off-axis optics

  • 13 October 2020
  • 7 replies
  • 709 views

Userlevel 2
Badge

Dear support team,


I am working with a complex off-axis optics with several stray-light baffles.

I need to determine the vignetting as a function of the two field coordinates.

The first surface of my afocal system is the aperture stop.

With vignetting I mean a geometrical quantity defined as the number of rays from one field that reach the image divided by the number of rays that pass my aperture stop.


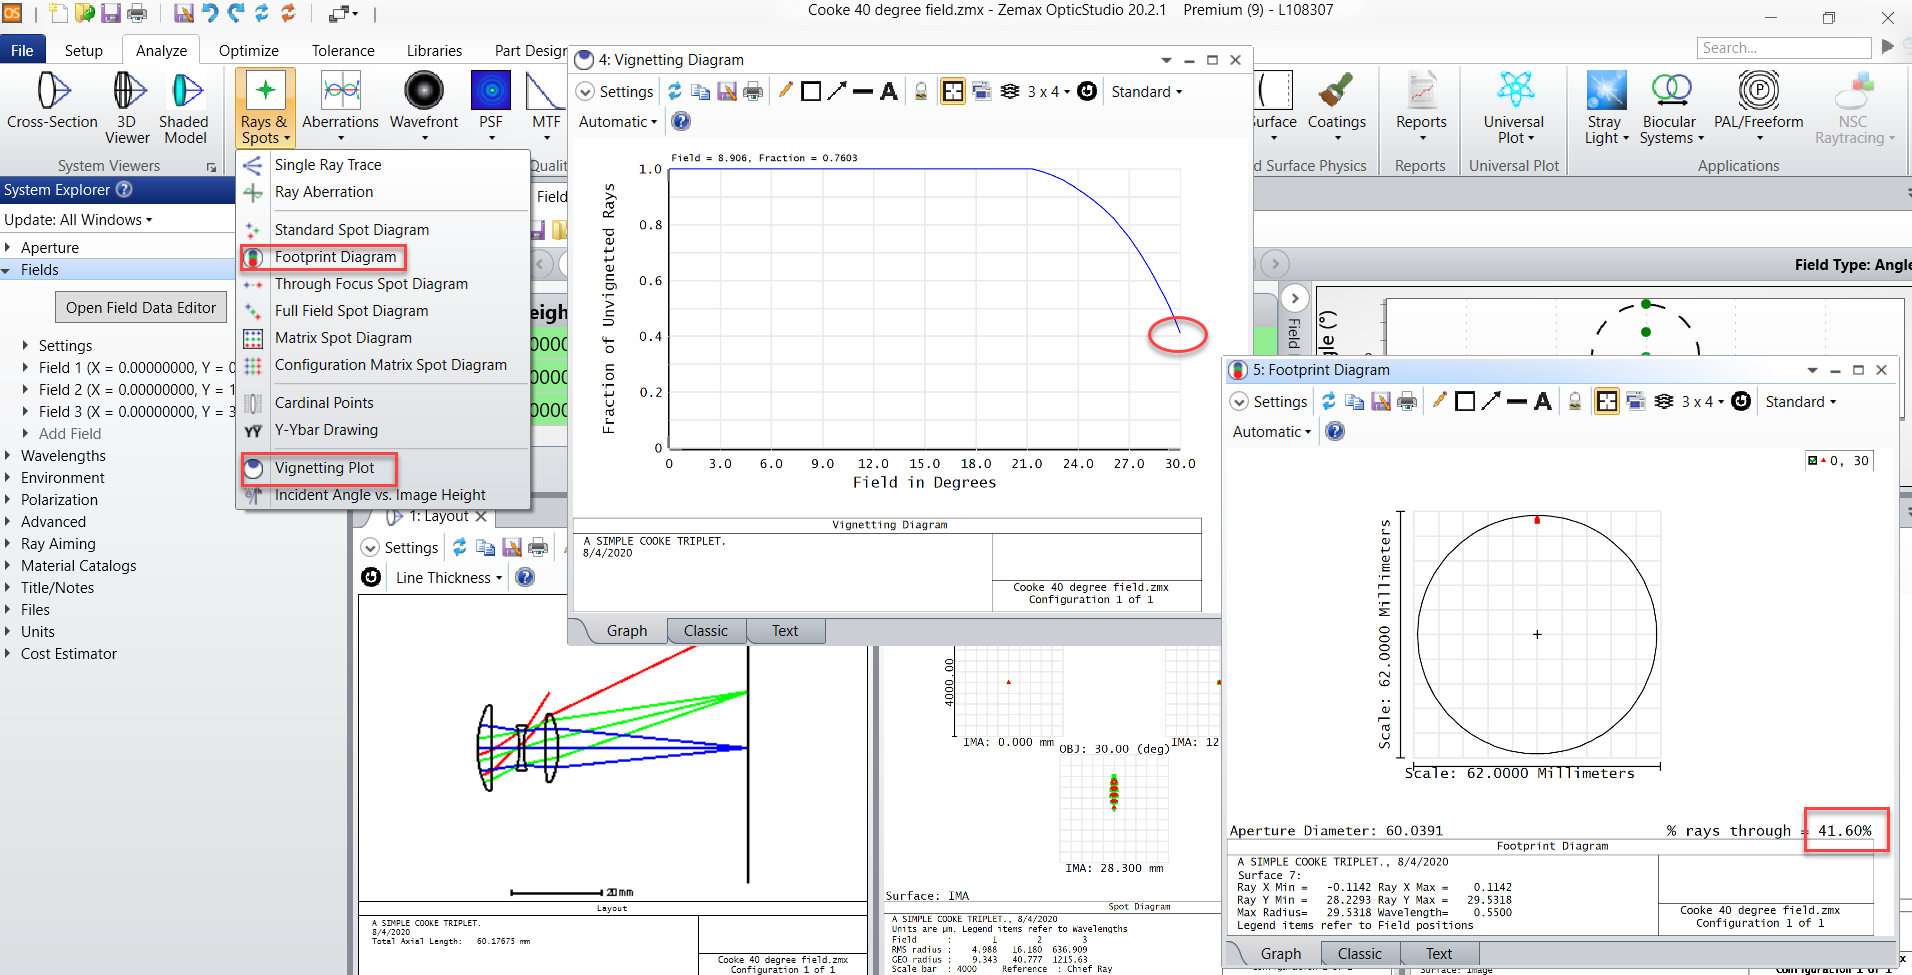
I think this is basically what the Zemax  'Vignetting Plot' does.  But: 'This feature is appropriate for rotationally symmetric lenses and fields' only.


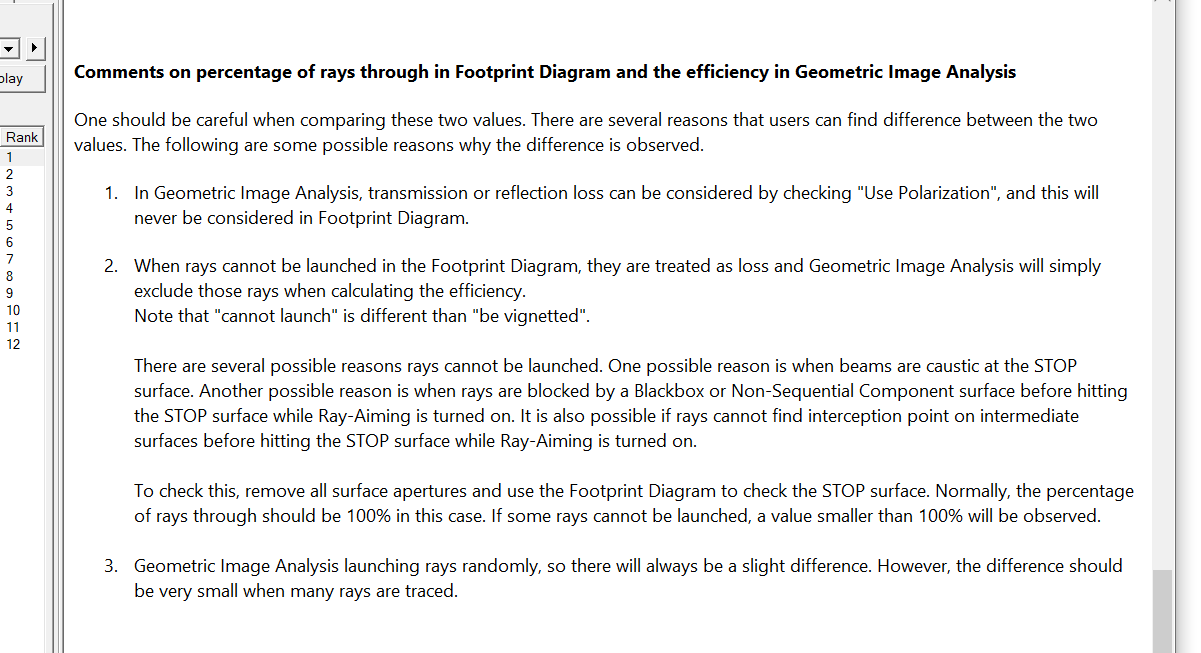
The Footprint Diagram determines the 'percentage of rays through', which should be the same. Is this correct?


Is there an Operand available, that calculates the vignetting according to what these two plots do and which I can calculate over a 2D-field with ZPL?


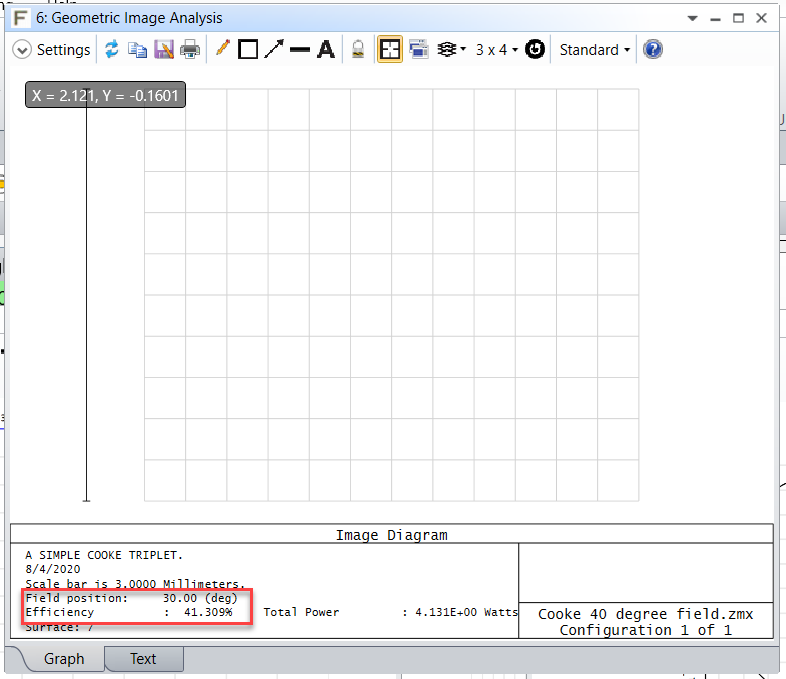
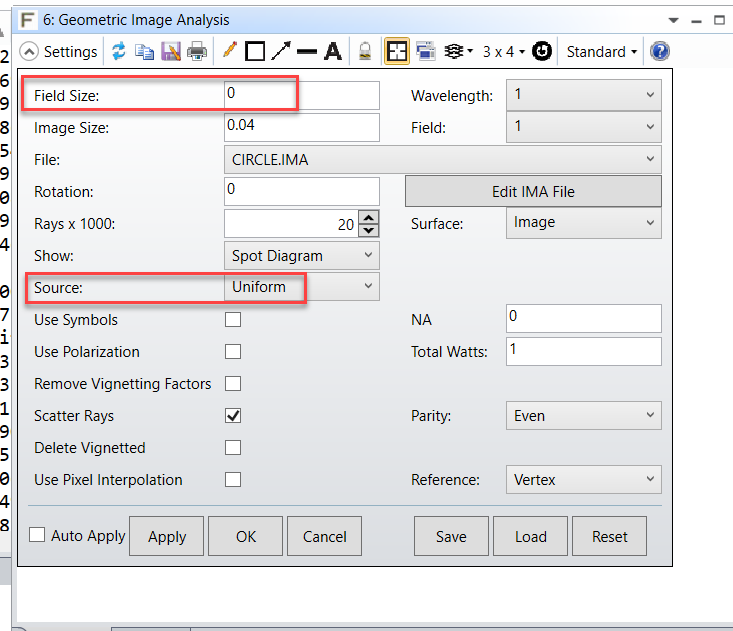
I found the IMAE Operand: 'The IMAE operand estimates the efficiency of an optical system by launching many rays into the entrance pupil; computing the fraction of rays that pass through all surface apertures to any surface.'

However, I do not understand how and why it is linked to the “Geometric Image Analysis”. It seems to be a more complex analysis and gives different results.


I would be grateful if you could help me finding a way to determine Vignetting over a 2D field with ZPL.


Thanks in advantage,

Christof.

icon

Best answer by Hui Chen 14 October 2020, 01:57

View original

7 replies

Userlevel 4
Badge +1

Hi Christof,


Thank you for contacting Zemax support!


OpticStudio has 3 tools that can return the percentage rays through or the vignetting effect of the system, Vignetting plot, Footprint diagram and Geometric Image Analysis (IMAE operand).  


The Vignetting Diagram calculates the fractional vignetting as a function of field angle. And the Footprint diagram displays the footprint of the beam superimposed on any surface, which can be used for showing the effects of vignetting and for checking surface apertures. In the example below, the field #3 has an angle of 30 degrees and you can see a lot of rays launched from this field point are being vignetted. If you check the Vignetting Diagram, it shows 41.1% Unvignetted rays at 30-deg field, (the y axis is the 'Fraction of Unvignetted Rays'). Now if you look at the Footprint diagram on the image surface, you can see a '% rays through = 41.6%' which matches the results from the Vignetting plot.


You can also use the Geometric Image Analysis and IMAE operand to calculate the % effciency. In this case, it's computed to be 41.3% which also matches the result from the Vignetting plot and the Footprint diagram. 


You mentioned that you saw different results from the IMAE oeprand vs the Geometric Image Analysis % efficiency. This is weird. These two should provide the exact same results. One key thing to watch out for when using the IMAE operand is that you need to first set up your Geometric Image Analysis window properly and then press the Save button under Settings. This way OpticStudio will save a configuration file and the same config will be used on the IMAE operand in the Merit fucntion editor, so that the IMAE will report the same % efficiency as listed in the Geometric Image Analysis window.  


I hope this answers your question. If you need clarifying or have any other questions, please feel free to let us know. We are happy to help however we can!


Best regards,


Hui

Userlevel 2
Badge

Hi Hui,


thank you for your message!


I did actually not mean to say that the 'IMAE' Operand gives a different 'Efficincy' result than what the 'Geometric Image Analysis' window shows. But now I recognized, that this is also the case. The 'Geometric Image Analysis'window gives with each update a slightly different value, while the 'IMAE' oerand gives always exactly the same result - which is also similar. Do you know, what this random noise is? Monte-Carlo? And why only in the Analysis Window and not for the Operand?


As there is this IMAE Operand, which I could use in a ZPL script, I would like to use it. (There is no comparable Operand for the Footprint Diagram, right?) However, the 'Geometric Image Analysis' does not seem to be exactly what I need: I need a *single source*, and a uniform sampling of the entrance pupil. But this Analysis provides an extended source. So I will probably have to set the 'Field size' to 0, right? Then it should basically do what the Footprint Diagram does?


But there appear some more questions to me:


- Do I need a certain 'File' that describes the object to map? Or does it make no difference for 'Field size' = 0?

- Is the pupil sampling uniform?

- the Image Size has no effect, right?

- Polarization must be unchecked.

- What about 'Remove Vignetting factors'? It does not seem to change anything in my case.

- What about 'scatter rays'?

- NA: This is strange, as  the NA is normally determined in the Aperture settings.


Now, finally the 'percent efficiency ' is close to the 'Rays through'. Should it be the same ? I am getting for one example 'percent efficiency' from IMAE = 90.2% and Rays through = 89.7%. Ray density is 200, which is the maximum. Rays x 1000 is 100, which takes already some calculation time. Maybe a different Distribution of the rays could be the reason for the (small) difference?


My current goal is only to account for the pure vignetting in a geometrical sense. (More has to follow later.) I hoe we can clarify everything so that I can then use IMAE.


Thank you and best regards,

Christof.

Userlevel 4
Badge +1

Hi Christof,


Thank you for your reply!


Regarding your first question, yes, although the IMAE operand and the GIA analysis use the same algorithm, they are probably launching different sets of random rays. The GIA analysis most likely uses truly random sets of rays so every time you referesh the analysis, you see slightly different % value. However, the IMAE operand uses the same set of random rays so the % efficiency remains the same everytime you update the Merit function editor. Therefore, the IMAE will give you very similar % efficiency as that of the GIA, but may not be identical. And the reason for this is that IMAE is mainly used in the merit function editor for optimization, and in order to supress the noise caused by using different random sets of rays during optimizaiton, OpticStudio will use the same set of random rays everytime the IMAE operand is called. 


Regarding your second question on using point source and uniform illumination of pupil in the GIA, your understanding is correct. If you set the Field Size to 0, then it'll be a pointn source, and you can set the Source to Uniform, so the pupil will be uniformly illuminated. 


Regarding your next set of questions below:


- Do I need a certain 'File' that describes the object to map? Or does it make no difference for 'Field size' = 0?


When setting Field Size to 0, it does not matter which image file you choose.


- Is the pupil sampling uniform?


The pupil sampling should be uniform, if there is no apodization factor applied.


- the Image Size has no effect, right?


The image size does not have any effect if the SHow As is set to Spot Diagram. But if the Show As is set to other options, like False Color, the the Image Size sets the size of the detector used to capture rays. Rays landing outside of the image size are ignored, and are not included in the total detected rays, which will decrease the computed efficiency.


- Polarization must be unchecked


Yes, if you don't care about polarization and coating effect. 


- What about 'Remove Vignetting factors'? It does not seem to change anything in my case.


If you did not use any Vignetting factors in your system as defined in the Field Data Editor, then it has no effect. 


- What about 'scatter rays'?


If you do not have a Scattering profile defined on any surface, then it has no effect.


- NA: This is strange, as  the NA is normally determined in the Aperture settings.


The NA defines the acceptance angle of the detector. This is mainly for modelling multimode fiber coupling efficiency. If you know the receiving fiber NA, you can enter it here to model coupling efficiency. Otherwise you can leave it to 0.


You can find a detailed description on how to use these settings at The Analyze Tab (sequential ui mode) > Image Quality Group > Extended Scene Analysis > Geometric Image Analysis


Regarding your last question on the different between GIA % efficiency and the Footprint diagram % rays through, there is a subtle difference between the two. You can find a good discussion in the Help File at The Analyze Tab (sequential ui mode) > Image Quality Group > Rays and Spots > Footprint Diagram. This discussion explained a few scenarios where these two analysis may not yield the exact same results. 


I hope this answers your question. Let us know if you have any other quesitons.


Best regards,


Hui


Userlevel 2
Badge

Hi Hui,


thanks a lot for your valuable help! I think now I understand it good enough to use it.


There is actually one thing that concerns me a bit:  My use case is the calculation of vignetting. This is probably not the main focus of the GIA tool. I use the rays that go through the system as a measure for the aria of the entrance pupil that is mapet to the exit pupil. So this would require a  uniform sampling  of the entrance pupil. But 'Geometric Image Analysis launching rays randomly'. I would assume that in the limit of many rays the sampling of the entrance pupil will become uniform, right? But this will require many rays. Using rays is inefficient as a measure for the area anyway, and randomly distributed rays are even more inefficient. So the Footprint Diagram may be better for me, but there is no according Operand, I think? And an algorithm that would interpolate the areas based on the rays would be even better, if this would be available.


But I think as a first approach, IMAE is probably good enough. So I will use it in a ZPL script. I will probably have to add some kind of transmission model in the future anyway.


    Thanks again, take care,

        Christof.

Userlevel 4
Badge +1

Hi Christof,


Thank you for your reply. Yes, i think the GIA has certain level of randomness to it. The ray set is randomly choosen launched from each pixel of the source bitmap. Like you said, if you crank the sampling high enough, eventually you'll get more consistent results. But i think for you application, you might be more suitable to use Footprint diagram which samples the pupil using fixed set of rectangular grid of rays. 


There isn't an operand that can directly return the % Rays through value listed in the Footprint diagram. And I don't think there is anything readily available in the UI that directly interpolate the pupil area based on rays through, so for that you'll need to do some post data processing on your end. 


Hope this answers your question. Let us know if you have other questions. 


Best regards,


Hui

Userlevel 2
Badge

Thank you Hui, yes, you answered my questions very well. My ZPL script is already running 🙂. Your support as well as the support of your colleges is a big help to me. Yes, I may do some post processing with the Zemax data.


Do you think a special vignetting operand would be a good idea to implement in the future, as it is a quite general topic?


Best regards, Christof.

Userlevel 4
Badge +1

Hi Christof,


Yes, i do think an operand that can directly return the % rays through from Footprint diagram to the MFE for optimization would be a useful addition. I could put in a feature request to our Product team for evalulation. However, whether the feature request will eventually be implemented will be determined by several factors, like the number of customers who require it or the difficulty of implementing it. But I agree this operand would be quite useful.


Thank you for the suggestion and please feel free to let us know if you have any other questions! 


Best regards,


Hui

Reply