Solved

ZOS-API Wavefront map populated by zeros

  • 2 March 2022
  • 3 replies
  • 252 views

Hi Zemax community,

I am a student who is learning to use the ZOS API in Matlab and I’m having issues with getting results from New_WavefrontMap. How do I correctly pull data from a wavefront map? As the results I plot are always zero.

I am running a wavefront analysis and POP analysis in the same program, which uses the ‘Double Gauss 5 degree field.zmx’ file from samples. I apply the analysis then pull the results using the following code to get the data:

WF_Map_Data = New_WF_map_results.DataGrids(1).Values.double;

matrixData = POP_Results.DataGrids(1).Values.double;

and try to plot it in Matlab the matrix will be populated by zeros.
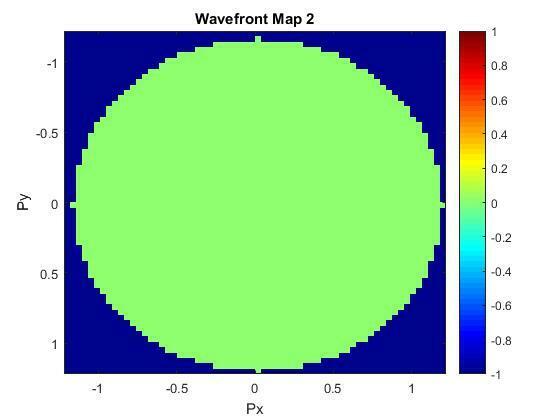
Wavefront map populated by 0’s

Both wavefront map and POP are set up in a similar fashion, but when plotting the results of the POP it will not be populated by zeros.
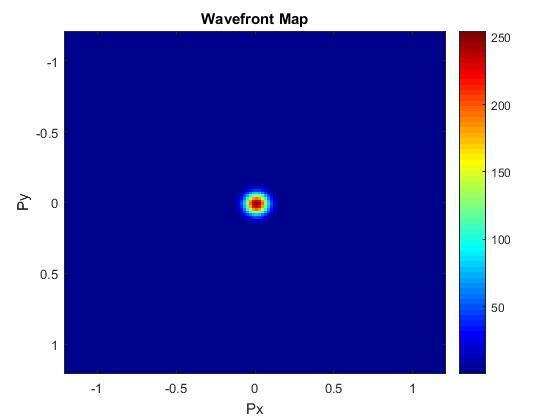
POP result

Thanks for reading

Nick

icon

Best answer by Jeff.Wilde 3 March 2022, 08:39

View original

3 replies

Userlevel 7
Badge +3

I’m not sure why your wavefront data is all zeros.  Perhaps you can share more of your Matlab code?

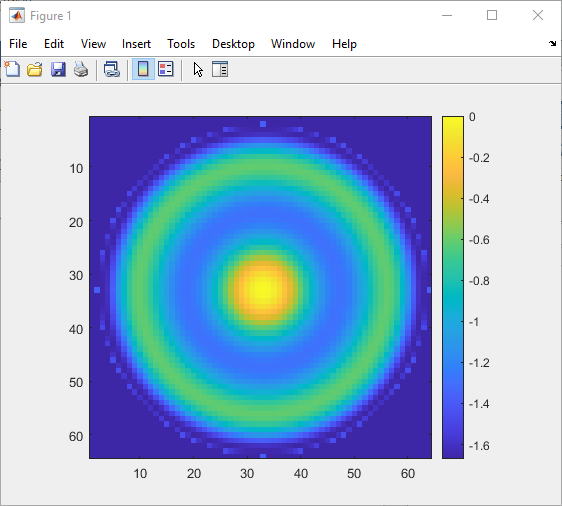
When I use the same sample file, and run the following code, it seems to work okay:

% Create new wavefront analysis
New_WF_map = TheSystem.Analyses.New_WavefrontMap();

% Run Analysis & gets results
New_WF_map.ApplyAndWaitForCompletion();
WF_Map_Data = New_WF_map.Results.DataGrids(1).Values.double;

% plot results
figure, imagesc(WF_Map_Data), axis image
colorbar


Hi Jeff, thanks for your reply. Here are the parts of the code which take the wavefront analysis:

Creating the analyses and wavefront analysis are done through these lines

% Create analysis
    TheAnalyses = TheSystem.Analyses;
    New_WF_map = TheAnalyses.New_Analysis(ZOSAPI.Analysis.AnalysisIDM.WavefrontMap);


After creating the analysis the field and wavelength number are set to 1

    %Wavefront settings
    New_WF_Settings = New_WF_map.GetSettings();
    New_WF_Settings.Wavelength.SetWavelengthNumber(1);
    New_WF_Settings.Field.SetFieldNumber(1);


I then apply the analysis and grab the results

    % Run Analysis & gets results
    New_WF_map.ApplyAndWaitForCompletion();
    New_WF_map_results = New_WF_map.GetResults();


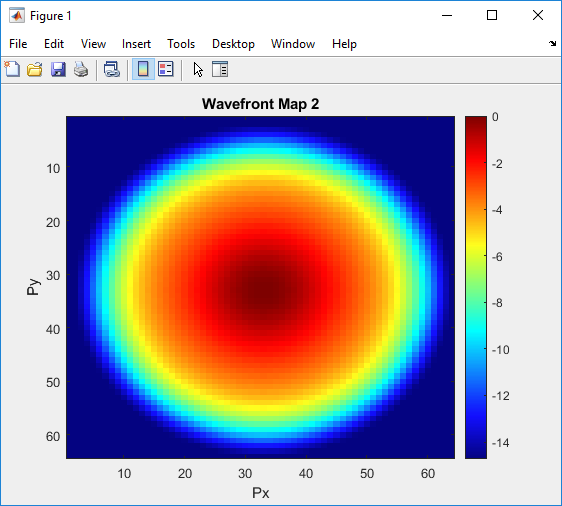
Then the results are plotted with the following code

    %Plot wavefront
    WF_Map_Data = New_WF_map_results.DataGrids(1).Values.double;
    figure
    imagesc(WF_Map_Data);
    colorbar;
    title('Wavefront Map 2')
    colormap(jet);
    xlabel('Px');
    ylabel('Py');

Userlevel 7
Badge +3

Looks fine to me.  When I run your code with the “Double Gauss 5 degree field.zos” lens I get the expected result:


Reply