Hi,


In the ZOSAPI, the settings for the Physical Optics Propagation analysis feature are now fully implemented:
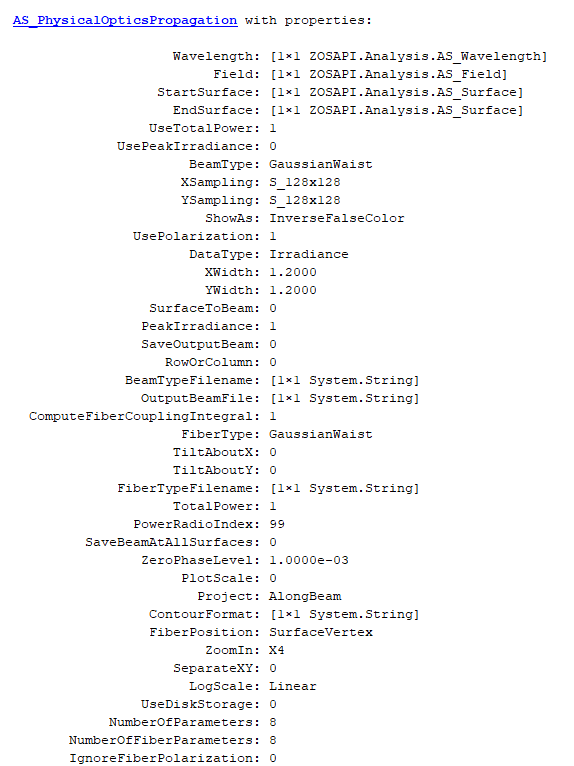


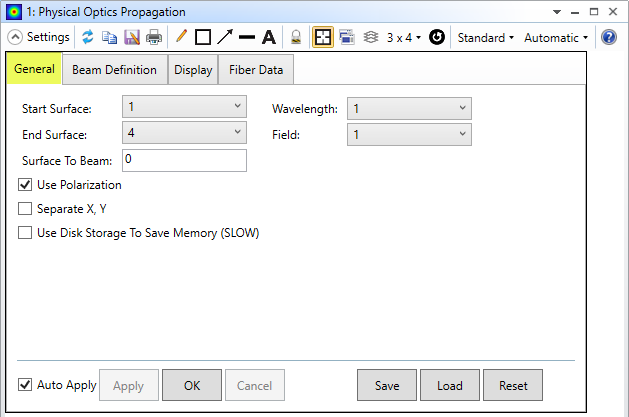
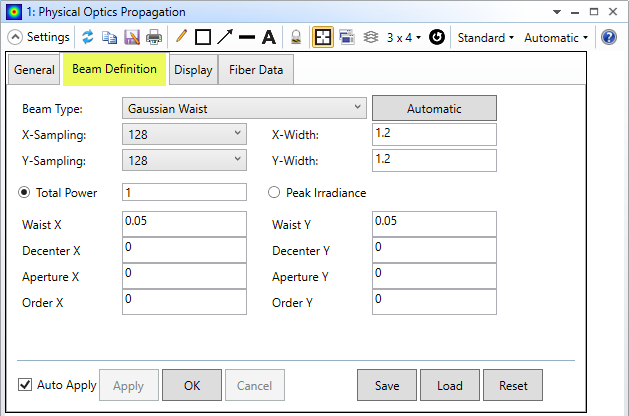
So as an example, we may set the settings in the 'General' and 'Beam Definition' tabs using the ZOSAPI in MATLAB:


TheSystem = TheApplication.PrimarySystem;


TheAnalyses = TheSystem.Analyses;


newPOP = TheAnalyses.New_Analysis(ZOSAPI.Analysis.AnalysisIDM.PhysicalOpticsPropagation);


newPOP.HasAnalysisSpecificSettings;


newPOP_Settings = newPOP.Settings();


newPOP_Settings.Wavelength.SetWavelengthNumber(1);


newPOP_Settings.Field.SetFieldNumber(1);


newPOP_Settings.StartSurface.SetSurfaceNumber(1);


newPOP_Settings.EndSurface.SetSurfaceNumber(4);


newPOP_Settings.SurfaceToBeam = 0.0;


newPOP_Settings.UsePolarization = true;


newPOP_Settings.SeparateXY = false;


newPOP_Settings.UseDiskStorage = false;


newPOP_Settings.BeamType = ZOSAPI.Analysis.PhysicalOptics.POPBeamTypes.GaussianWaist;


newPOP_Settings.XSampling = ZOSAPI.Analysis.SampleSizes.S_128x128;


newPOP_Settings.YSampling = ZOSAPI.Analysis.SampleSizes.S_128x128;


newPOP_Settings.XWidth = 1.2;


newPOP_Settings.YWidth = 1.2;


newPOP_Settings.UseTotalPower = true;


newPOP_Settings.TotalPower = 1.0;


newPOP_Settings.SetParameterValue(0,0.05)


newPOP_Settings.SetParameterValue(1,0.05)


newPOP.ApplyAndWaitForCompletion();


newPOP_Results = newPOP.GetResults();


Best,


Ali

Does the GetResults method output the same results, that are saved to the .ZBF file?


Hi Nils,


Thanks for your your question here!


The line:


newPOP_Results = newPOP.GetResults();


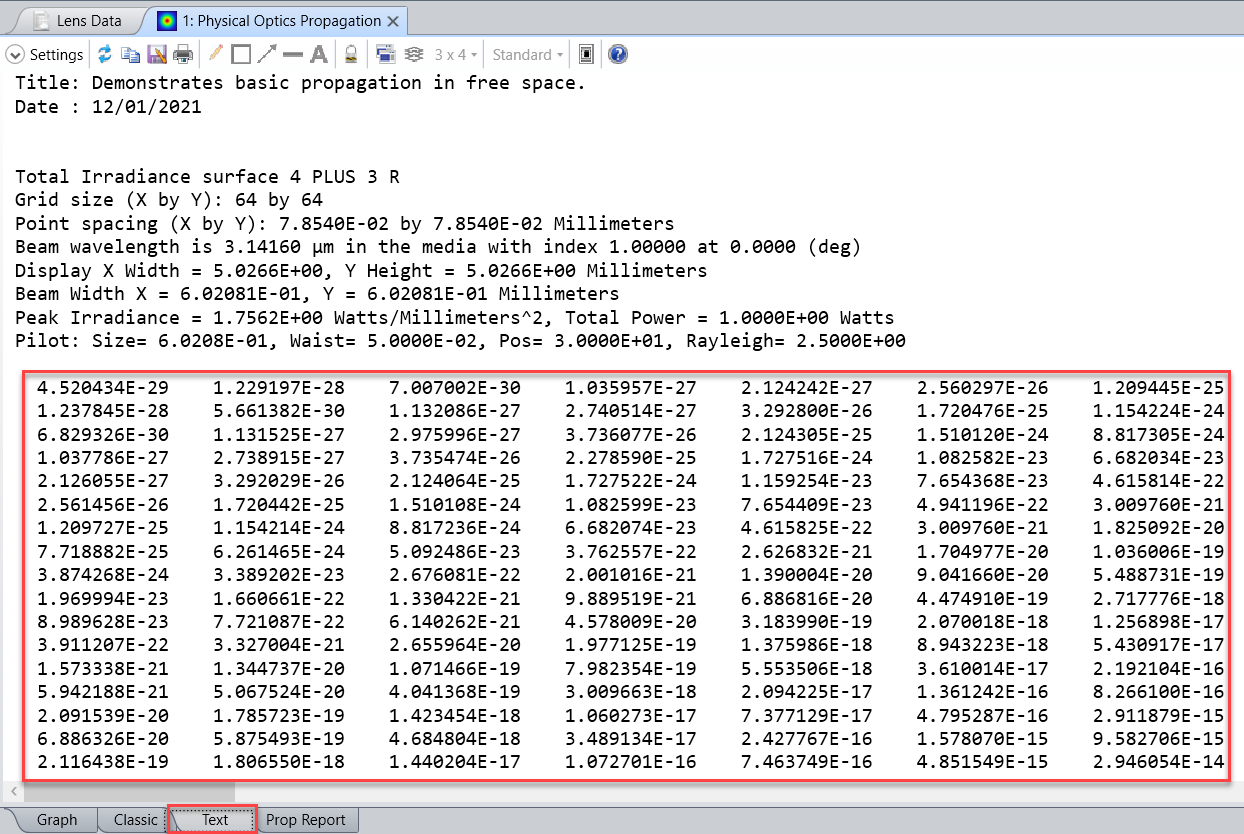
retrieves the matrix data provided in the Text tab of the analysis window:


You may use the following line to access the data:


matrixData = newPOP_Results.DataGrids(1).Values.double;


You may find more instructions about how to process and plot these data in this from thread from my colleague Allie:


How do I output the image of an analysis in ZOS-API? · MyZemax


Besides, more information on how to access the header and meta data from the analysis window can be found here:


How can I pull Peak Irradiance or Total Hits from the Detector Viewer analysis in the API? · MyZemax


If you have further questions, please let us know!


Best,


Csilla


Hi ,


This post was really useful to get started quickly in Python, but I find it difficult to set the settings described by Ali in C#. Is there any similar help for that?


Regards,


Jose


Hi Jose


Sorry I'm not sure I understand your post. Are you looking for help regarding ZOS-API or regarding POP set-up in general?


Sandrine


Hi Sandrine, 


It was about the ZOSAPI. I had trouble finding how to access the specific settings of the POP analysis in C# and editing them in an easy way, but I found the answer:


'...


using ZOSAPI.Analysis.PhysicalOptics;


...


 IAS_PhysicalOpticsPropagation POPDef_Settings = POPDef.GetSettings() as IAS_PhysicalOpticsPropagation;


POPDef_Settings.Wavelength.SetWavelengthNumber(1);


....'


Regards,


Jose


Thank you for your reply, that will definitely help others.. Yes in C#, we need to cast the settings.


Nice example in MATLAB. How about C++. All I get for settings are things like SaveTo(cfgFile), not the settings I expect from reading the documentation. What am I doing wrong?


Hi! Sorry about the late reply. It seems that the settings are not implemented for C++. We will check with the developers and will let you know.


Hi again! I have submitted a bug regarding the POP setting in ZOS-API C++. I will let you know when we have a fix.


Hi! My colleagues have tested this and it is fixed in 22.2.1.


Hello,


I would like to know how to extract the fiber efficiency data from a POP analysis done via Matlab.


Thanks

Florence


Hi @Florence.Rigal 

It can be read via the header data:

%Get POP results
newPOP_Results = newPOP.GetResults();
headerlines=string(newPOP_Results.HeaderData.Lines);
fiberline=headerlines(8);

Let me know if that solution works for you.


Hi Sandrine,


Thank you , but it does not seems to work for my file. 

I did newPOP.ApplyAndWaitForCompletion();
newPOP_Results = newPOP.GetResults();

However, I managed to extract the coupling value using the merit function

POPD = ZOSAPI.Editors.MFE.MeritOperandType.POPD; 

  coupling  = TheSystem.MFE.GetOperandValue(POPD, 0, 0, 0, 0, 0, 0, 0, 0);


Florence


Hi Nils,


Thanks for your your question here!


The line:


newPOP_Results = newPOP.GetResults();


retrieves the matrix data provided in the Text tab of the analysis window:


210112-163905-image.png


You may use the following line to access the data:


matrixData = newPOP_Results.DataGrids(1).Values.double;


You may find more instructions about how to process and plot these data in this from thread from my colleague Allie:


How do I output the image of an analysis in ZOS-API? · MyZemax


Besides, more information on how to access the header and meta data from the analysis window can be found here:


How can I pull Peak Irradiance or Total Hits from the Detector Viewer analysis in the API? · MyZemax


If you have further questions, please let us know!


Best,


Csilla


It looks like these links are no longer working. 

I’m trying to use the API (in Python) to extract all of the E-Field data similar to what comes out of a ZBF, not just a single display set.  The work around I’m using right now is to set the configuration settings to save an output zbf file and then read that, but wondering if there is a faster way.  


Reply