Help Grabbing Wavefront Map data with MATLAB

  • 14 February 2021
  • 4 replies
  • 605 views

Hello Zemax Community,


I am struggling to navigate the OpticStudio API in MATLAB. What I'm attempting to do shouldn't be that difficult. I think my issue is I'm not an object oriented programmer, much less a competent software developer so I'm really struggling.


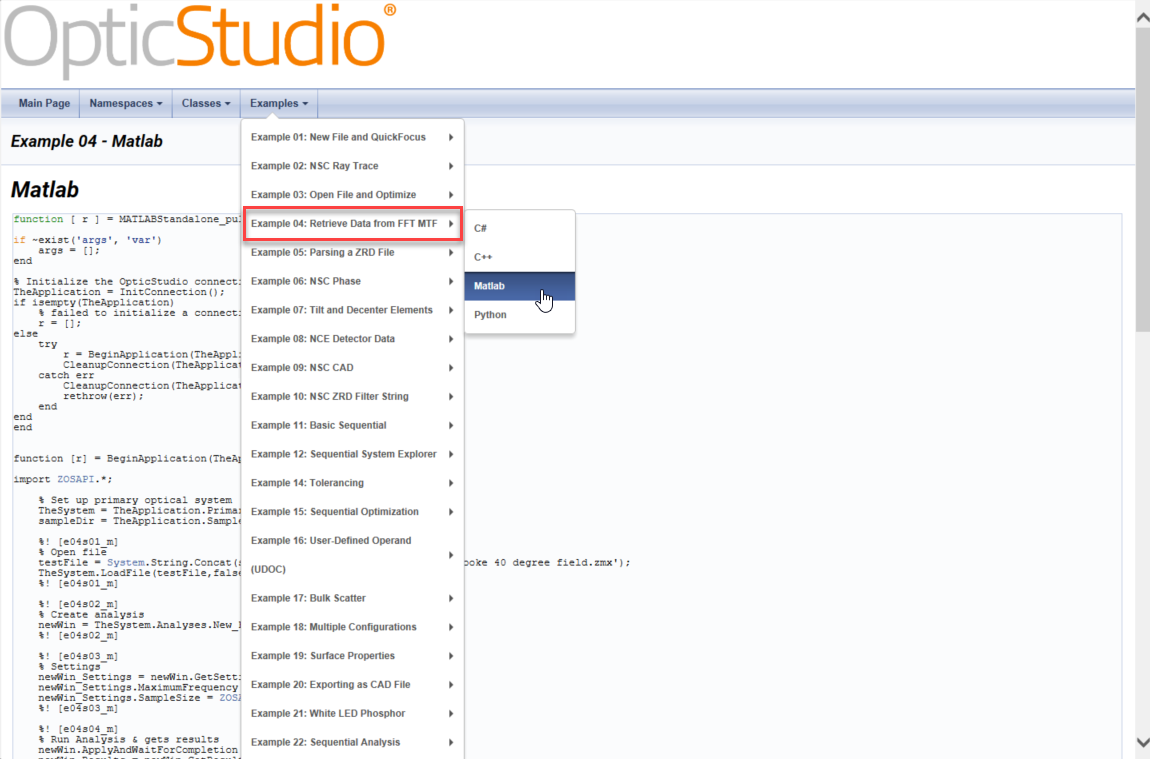
First thing I tried was consulting several helpful examples that successfully demonstrated grabbing analysis data through MATLAB. I've run and studies these and can grab wavefans, MTF and spot diagrams. Although the last one looked like it used the ray trace engine directly and not the spot diagram analysis function.


The specific example that I think would get me started is if I had example code showing how to pull wavefront maps at various fields and wavelengths in the 28deg double Gauss sample lens file.


I found the analysis method 'New_WavefrontMap' and can create the object in Matlab but can't figure out how to actually get the data. It does not appear as easy as grabbing a full double array. Rather it looks like all data is grabbed one element at a time, and the arguments needed to do this are very specific to each analysis object. After a few hours, I’m stuck.


Greatly appreciate any help. Thanks!


-Frank


4 replies

Userlevel 7
Badge +2

Hello Frank,


Unfortunately, I do not have MATLAB, and my trial expired already.


Here's one way to do it with a Python interactive extension (I don't think you need the reshape definition with MATLAB). I hope it helps:


# Modules
import matplotlib.pyplot as plt
# Definition from Standalone application
def reshape(data, x, y, transpose = False):
    '''Converts a System.Double[,] to a 2D list for plotting or post processing
    Parameters
    ----------
    data      : System.Double[,] data directly from ZOS-API 
    x         : x width of new 2D list [use var.GetLength(0) for dimension]
    y         : y width of new 2D list [use var.GetLength(1) for dimension]
    transpose : transposes data; needed for some multi-dimensional line series data
    Returns
    -------
    res       : 2D list; can be directly used with Matplotlib or converted to
                a numpy array using numpy.asarray(res)
    '''
    if type(data) is not list:
        data = list(data)
    var_lst = [y] * x;
    it = iter(data)
    res = [list(islice(it, i)) for i in var_lst]
    if transpose:
        return self.transpose(res);
    return res
# Create a Wavefront Map analysis
MyWavefrontMap = TheSystem.Analyses.New_Analysis(ZOSAPI.Analysis.AnalysisIDM.WavefrontMap)
# Retrieve Wavefront Map settings
MyWavefrontMapSettings = MyWavefrontMap.GetSettings()
# Change to field number 2
MyWavefrontMapSettings.Field.SetFieldNumber(2)
# Apply new settings
MyWavefrontMap.ApplyAndWaitForCompletion()
# Check the implementation status of this analysis feature in the ZOSAPI
print('Does Wavefront Map have fully-implemented settings?', MyWavefrontMap.HasAnalysisSpecificSettings)
# Retrieve Wavefront Map results
MyWavefrontMapResults = MyWavefrontMap.GetResults()
MyWavefrontMapGrid = MyWavefrontMapResults.GetDataGrid(0).Values
MyWavefrontMapArray = reshape(MyWavefrontMapGrid, MyWavefrontMapGrid.GetLength(0), MyWavefrontMapGrid.GetLength(1))
# Plot results
plt.figure()
plt.imshow(MyWavefrontMapArray)
plt.show()

Take care,


David

Userlevel 5
Badge +2

Hello,


Thanks for your question Frank, and for your answer David!


Let me add a couple more details/references here.


In order to change the Wavelength and the Field settings from Matlab you will need to use the following code:


newWin = TheSystem.Analyses.New_WavefrontMap();
% Settings
newWin_Settings = newWin.GetSettings();
newWin_Settings.Wavelength.SetWavelengthNumber(1);
newWin_Settings.Field.SetFieldNumber(1);

This is because you cannot set any number for the Wavelength or for the Field variable, but instead you can choose from the wavelengths/fields defined in the System Explorer, and here you just refer to its number.


In order to pull the results, as David mentioned you will need to use the following lines (my code is in Matlab):


newWin.ApplyAndWaitForCompletion();
newWin_Results = newWin.GetResults();
matrixData = newWin_Results.DataGrids(1).Values.double;

For further references about how to change the settings and pull the results, you may check out Example 4 - Retreive Data from FFT MTF in the ZOS-API Syntax Help:


Also, further explanation with a sample Matlab code is provided in this forum thread from Allie:


How do I output the image of an analysis in ZOS-API? · MyZemax


If you would like to pull the header data too, besides the matrix results, then you may find a detailed description on how to do it from Matlab in this forum thread:


How can I pull Peak Irradiance or Total Hits from the Detector Viewer analysis in the API? · MyZemax


I hope this helps, but if you have any further questions, please let us know and we will be happy to help!


Best,


Csilla

What are the codes for extracting the Peak-to-Valley or RMS wavefront values from the wavefront map analysis?


Where can I found the detailed class structures in the Syntax help? I was not successful using Search in ZOS-API manual, e.g. search 'wavefrontmap'.


Thanks,


Weichuan

Userlevel 7
Badge +2

Hi Weichuan,


You don't need to run a Wavefront Map analysis to get those values. In fact, you are better off with a Merit Function operand. I'd recommend ZERN with the following Term value (from the Help file):


-8: Peak to Valley OPD (to centroid)

-7: Peak to Valley OPD (to chief)

-6: RMS to zero reference (unused by OpticStudio)

-5: RMS to chief ray

-4: RMS to centroid


To call a Merit Function operand from the ZOS-API, simply use:


TheSystem.MFE.GetOperandValue(ZOSAPI.Editors.MFE.MeritOperandType.ZERN, Term, Wave, Samp, Field, Type, Epsilon, Vertex, 0)

Just replace the variables with whatever you think is relevant. For example, in an Interactive Extension with the Double-Gauss sample, you can type:


RMS_Wave = TheSystem.MFE.GetOperandValue(ZOSAPI.Editors.MFE.MeritOperandType.ZERN, -4, 2, 2, 1, 0, 0, 0, 0)
print(RMS_Wave)

And you'll get the value 0.2592, same as if you'd run a Wavefront Map analysis.


Let me know if this is clear, or if you need an example. This will be much faster than running a full Wavefront Map analysis.


Take care,


David

Reply