
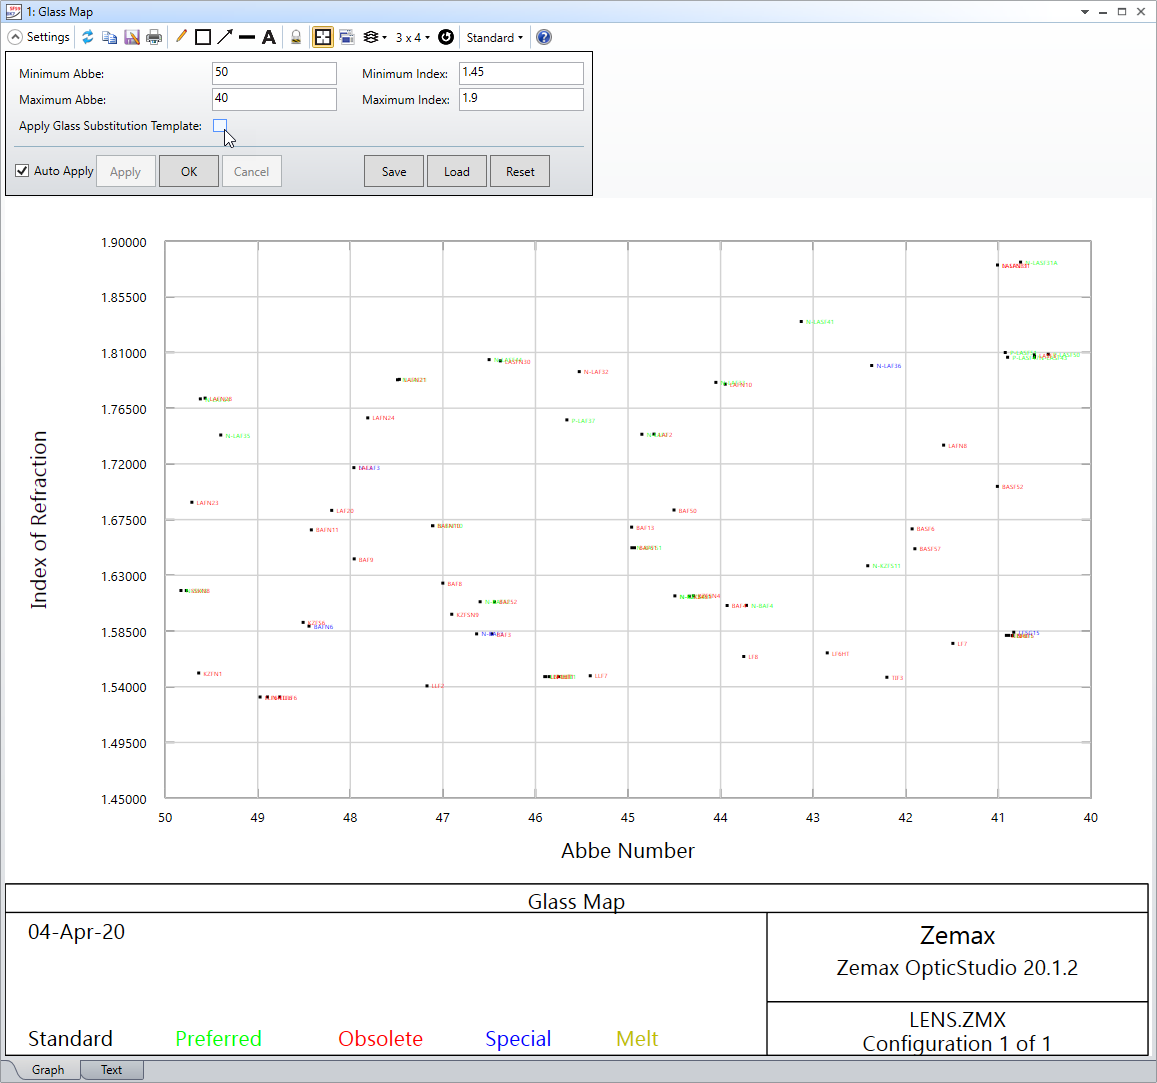
Feature request: glass map

When you zoom in on, say, an MTF plot you zoom on the graph but the axes remain, scaling up and down as appropriate. Can you arrange the glass map to do the same. When you zoom in on the map you immediately lose the axes.


Reply
Enter your E-mail address. We'll send you an e-mail with instructions to reset your password.
Need more help?
To Chinese users:
Do not provide any information or data that is restricted by applicable law, including by the People’s Republic of China’s Cybersecurity and Data Security Laws ( e.g., Important Data, National Core Data, etc.).
不要提供任何受适用法律,包括中华人民共和国的网络安全和数据安全法限制的信息或数据(如重要数据、国家核心数据等)。