Hi Yang,
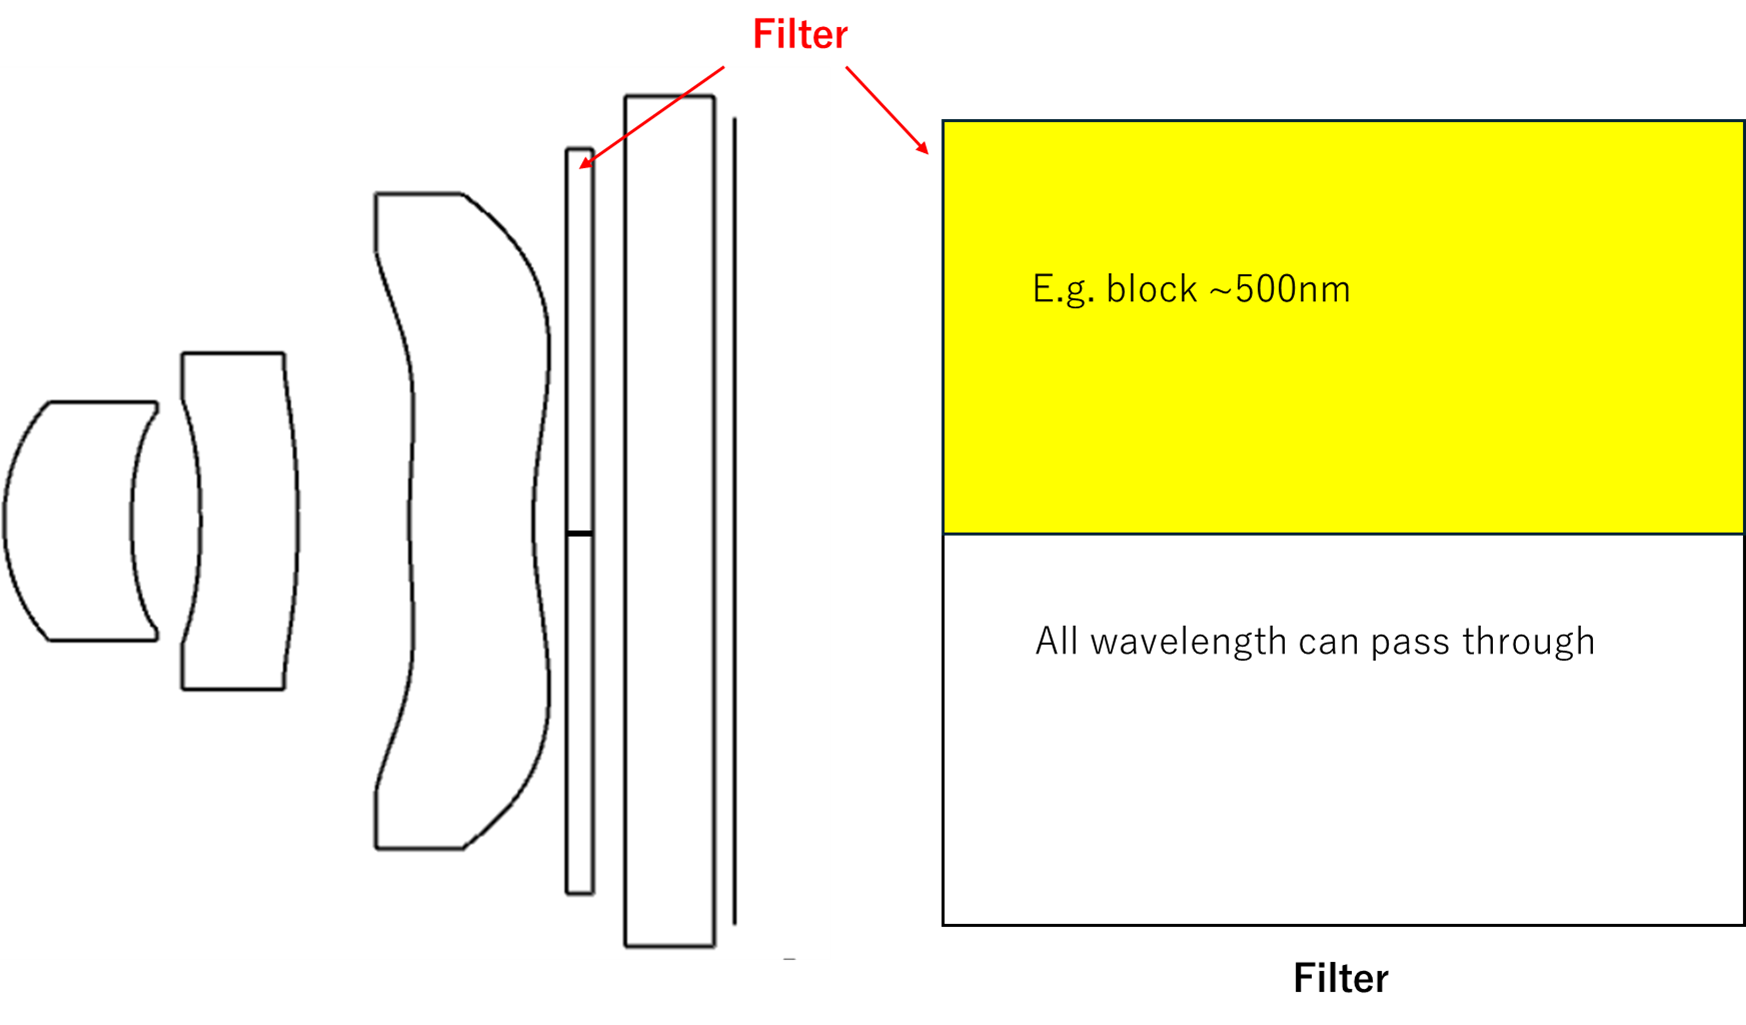
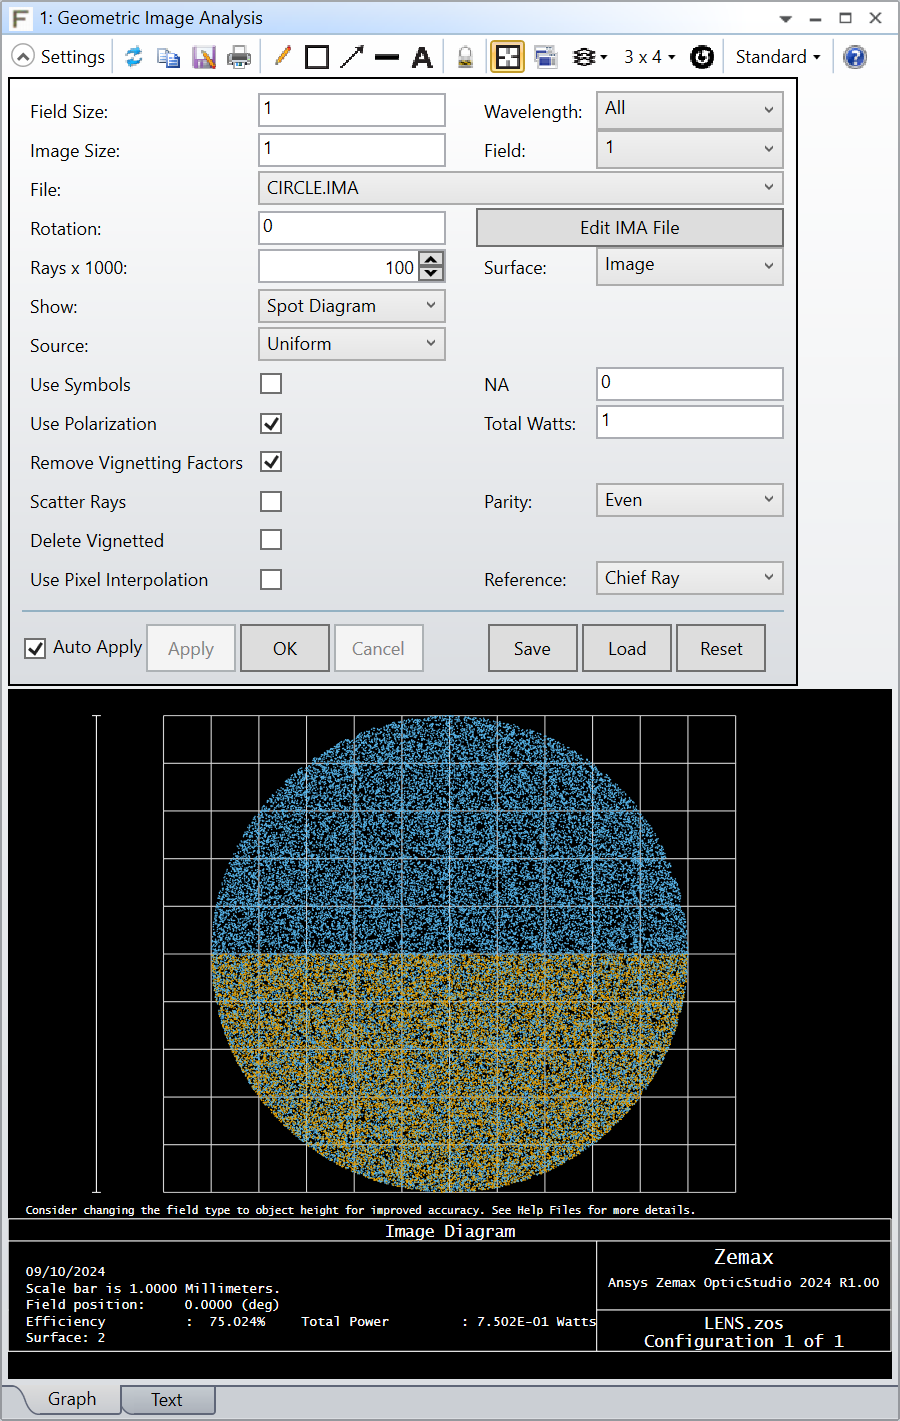
In sequential mode, a ray cannot “skip” a surface so you cannot simply have a single configuration with a 500nm band pass filter that is decentered. However, you can split your image plane into 2 halves with multi-configs, use a TABLE coating to create a cutoff filter and then use a number of paired down analysis which can merge the 2 configurations back together (Spot Diagram, Footprint Diagram, Geometric Image Analysis, Huygens PSF, Huygens MTF).
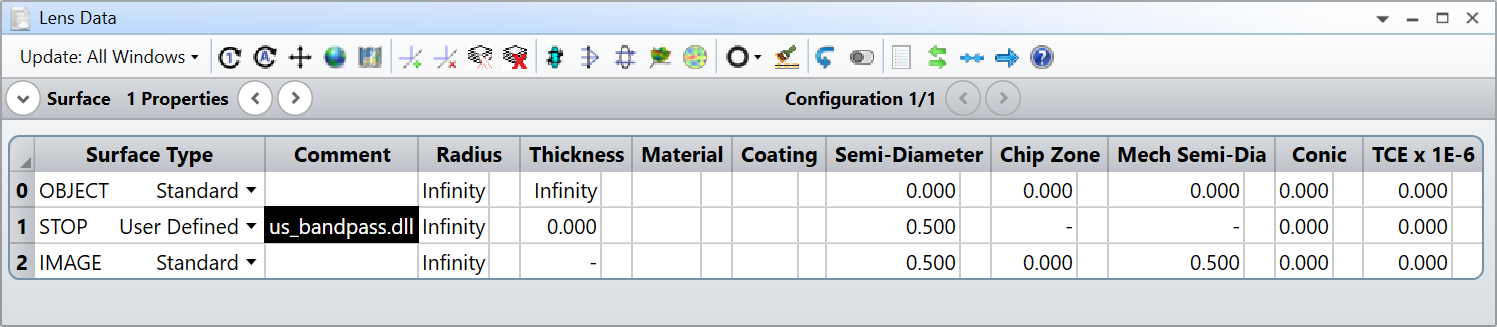
However, the better approach would be to create a User Defined Surface and leverage the UD->rel_surf_tran property. In the User Data structure, you have access to the ray’s XY coordinates (UD->x and UD->y) and in the Fixed Data structure, you have access to the ray’s wavelength (FD->wavelength). So the pseudo code in case 5 of the UDS would look something like this:
case 5:
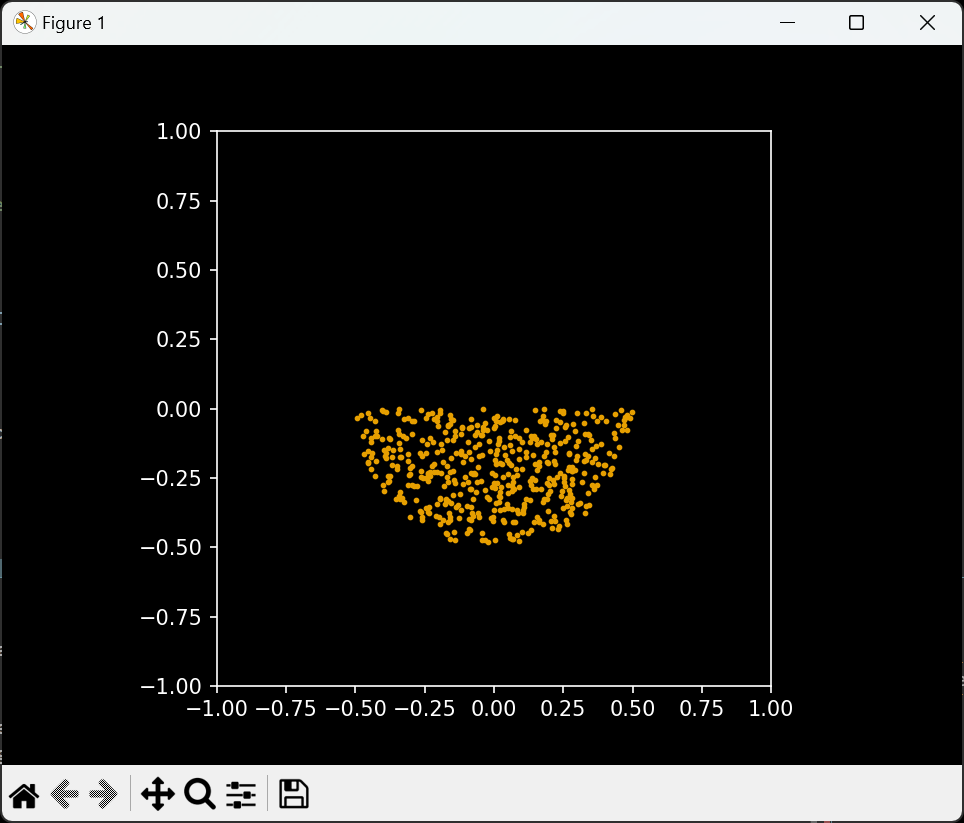
if (UD->y >= 0.0 && FD->wavelength >= 0.5)
{ UD->rel_surf_trans = 0.0; }
if (FD->cv == 0.0){
if (Refract(FD->n1, FD->n2, &UD->l, &UD->m, &UD->n, UD->ln, UD->mn, UD->>)) return(-FD->surf);
} else {
/* not a plane, copy code from UDS example for snell’s law refracting */
}
break;
There are 8 different UDS filter examples in the Zemax\DLL\Surfaces folder that can help you get started.
P.S. If you can use non-sequential, I would suggest doing that. This is a trivial problem in non-sequential mode.