hi Community
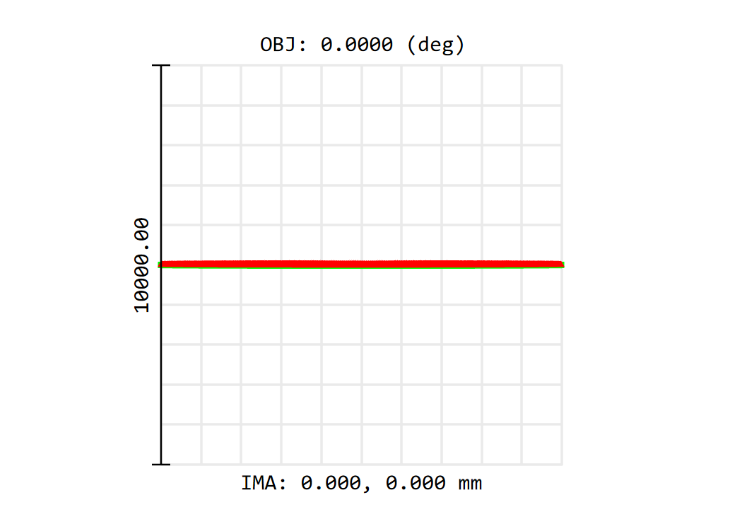
I am trying to set the grid(1000mmX1000mm) to a designed size, say 400mm X50mm
how can I make it? It seems that it always shows as square.
Thanks


hi Community
I am trying to set the grid(1000mmX1000mm) to a designed size, say 400mm X50mm
how can I make it? It seems that it always shows as square.
Thanks
Best answer by David.Nguyen
Hi Yang,
There are not many display settings for the Spot Diagram. Two of them should be mentioned here, although I don’t know if they’ll fix your problem. First, you have the Plot Scale, which allows you to zoom in and out of the grid by changing the size of the scale bar (the grid remains square though). Then, if you click and drag somewhere in the diagram, you can draw a rectangle around a region of interest and OpticStudio will zoom inside it.
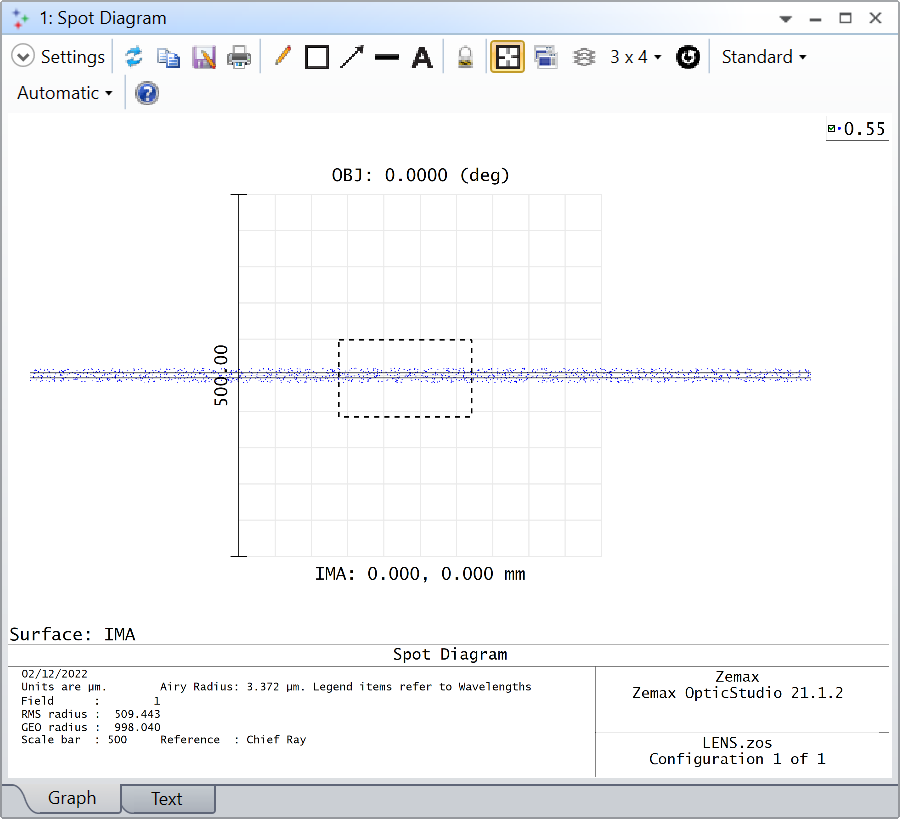
However, the shape of that region of interest has to be a rectangle with fixed proportions.
If you need to display a custom part of the spot diagram, I suggest using the ZOS-API. Its a bit more work, but the idea is that you trace your rays and select which ones you want to include in your analysis. Example 22 of the ZOS-API Syntax Help shows how to reproduce the Spot Diagram via ray tracing, and if you use it with Python or MATLAB, you can have much more freedom over your display settings. Let me know if you need more help with that (and consider sharing an example of what you’d want).
Take care,
David
Enter your E-mail address. We'll send you an e-mail with instructions to reset your password.
Do not provide any information or data that is restricted by applicable law, including by the People’s Republic of China’s Cybersecurity and Data Security Laws ( e.g., Important Data, National Core Data, etc.).
不要提供任何受适用法律,包括中华人民共和国的网络安全和数据安全法限制的信息或数据(如重要数据、国家核心数据等)。


