How to plot Intensity Transmission and Intensity Reflection
Hi, reading the user’s guide i saw different plots of the Intensity Transmission and Intensity Reflection as a function of the incidence angle and polarization. How can I visualize these kind of plots? I’m working in non sequential mode and have different volumes. I would visualize, for instance, the plots for the surface between volume 3 and volume 4. I thought it would be easy, but i’ve never read about how to plot these functions.
Thank you in advance.
Page 1 / 1
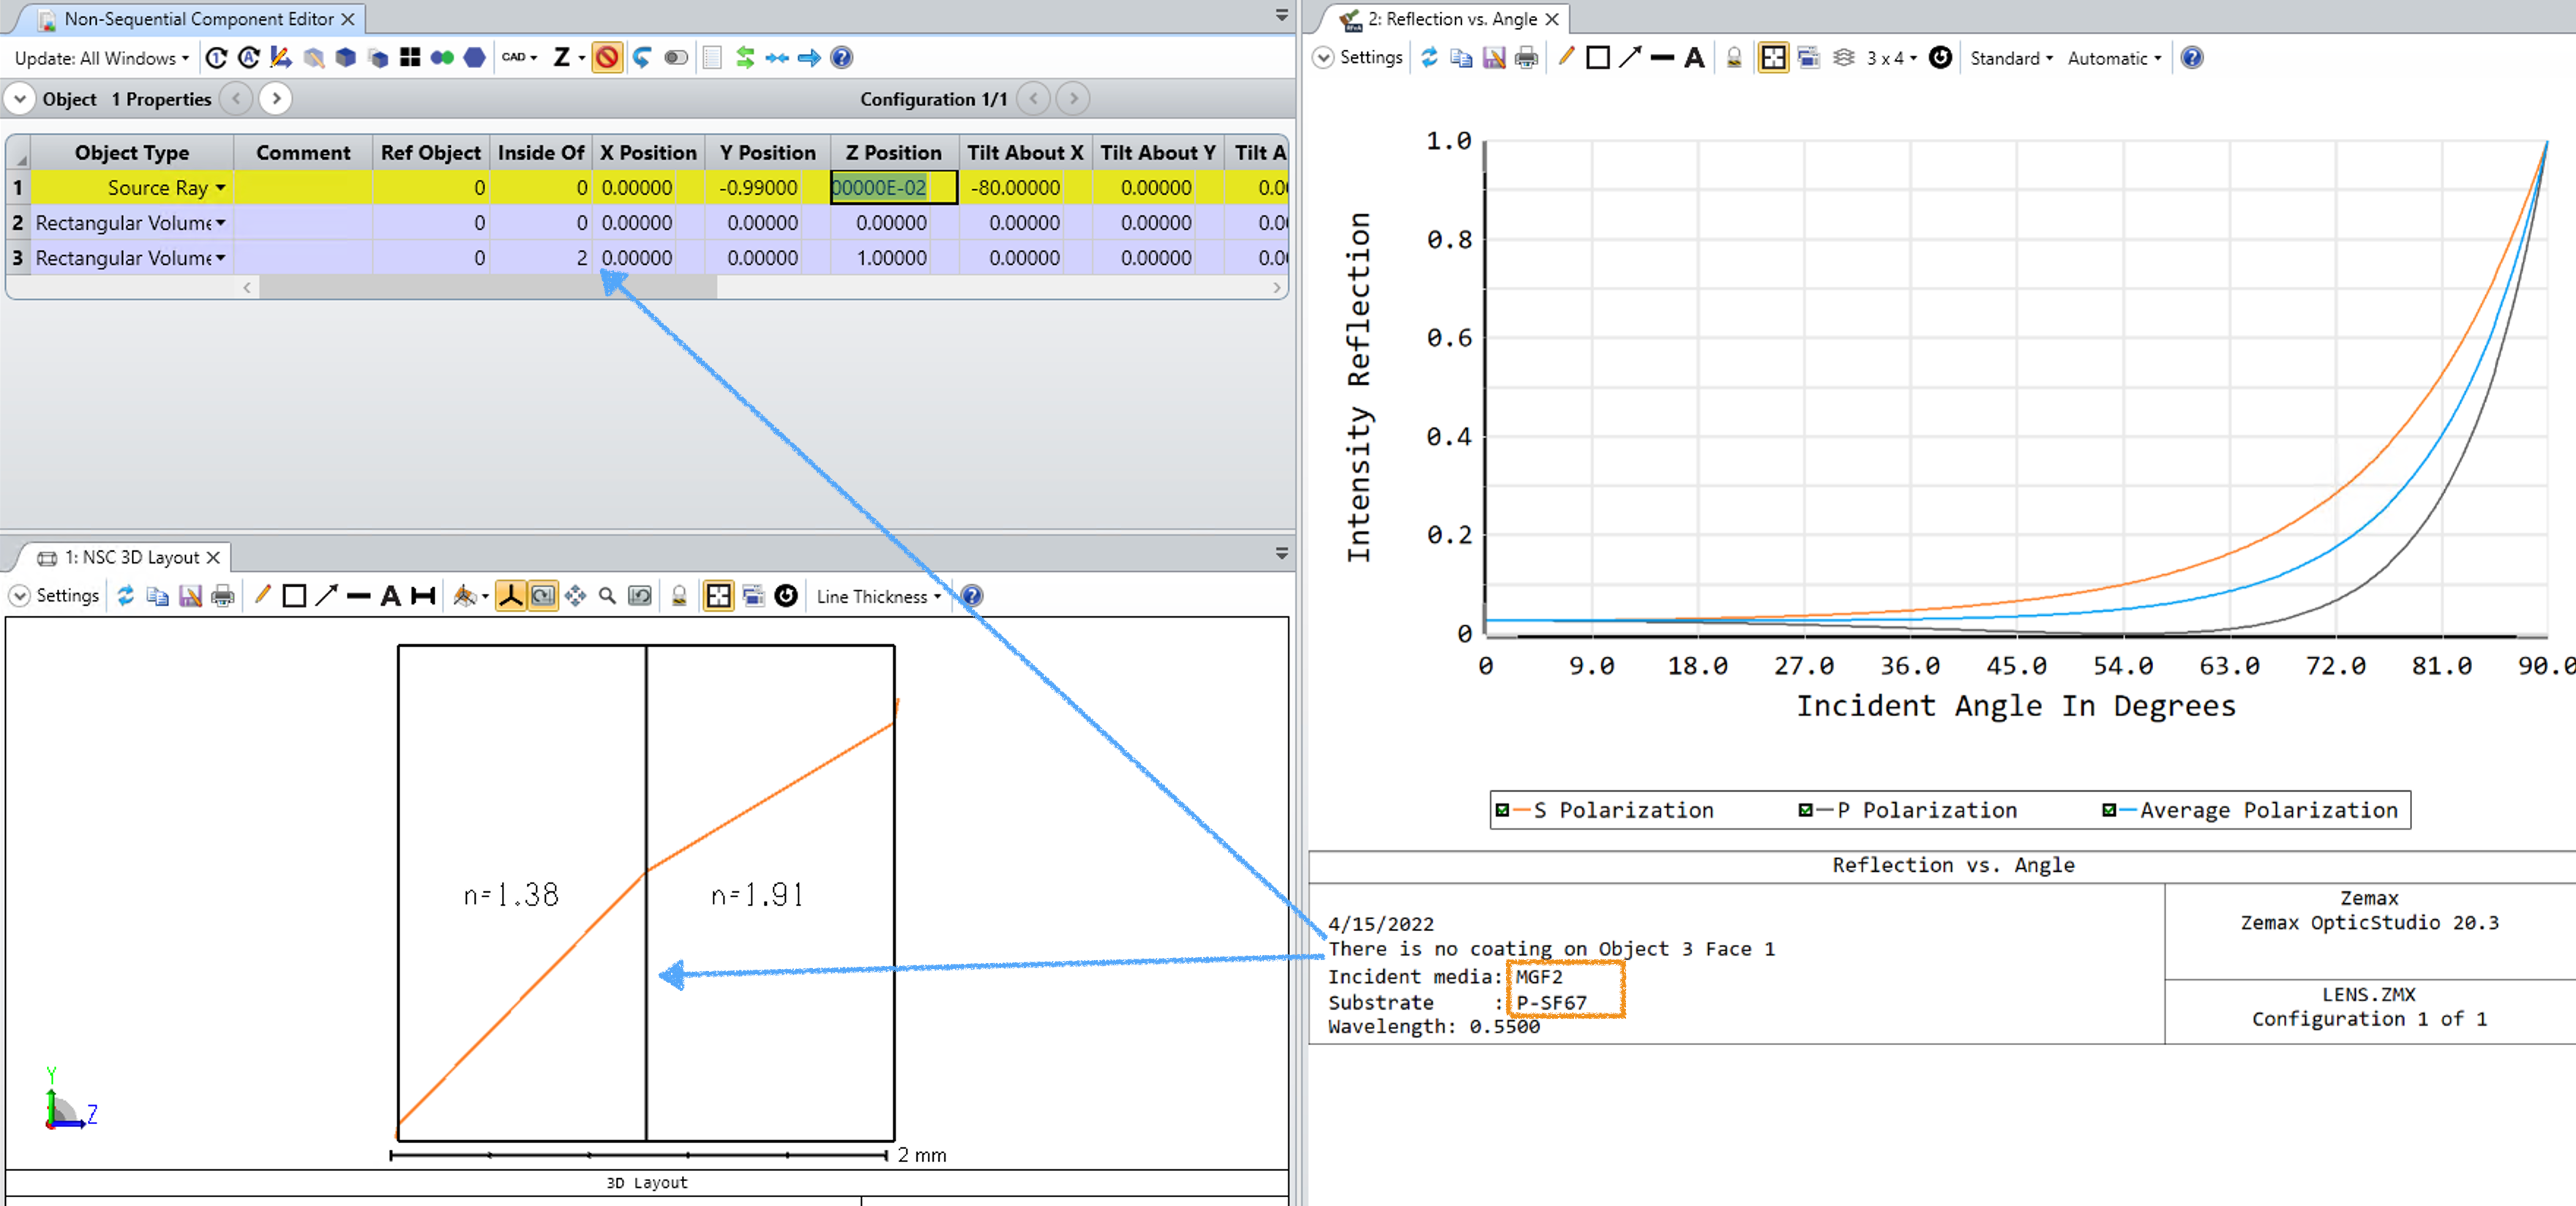
Take a look at the Polarization section on the Analyze tab:
With this tool you can calculate transmission/reflection responses for bare surfaces or surfaces that have a coating applied.
Hi Nicola,
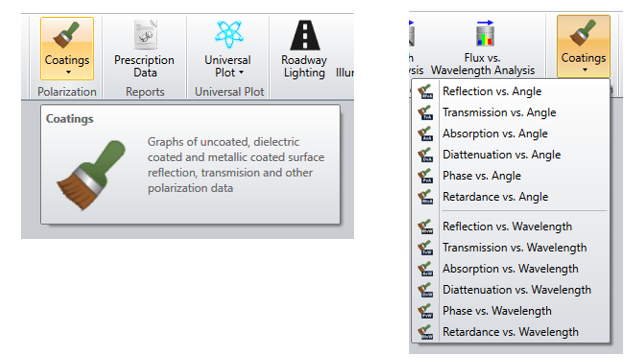
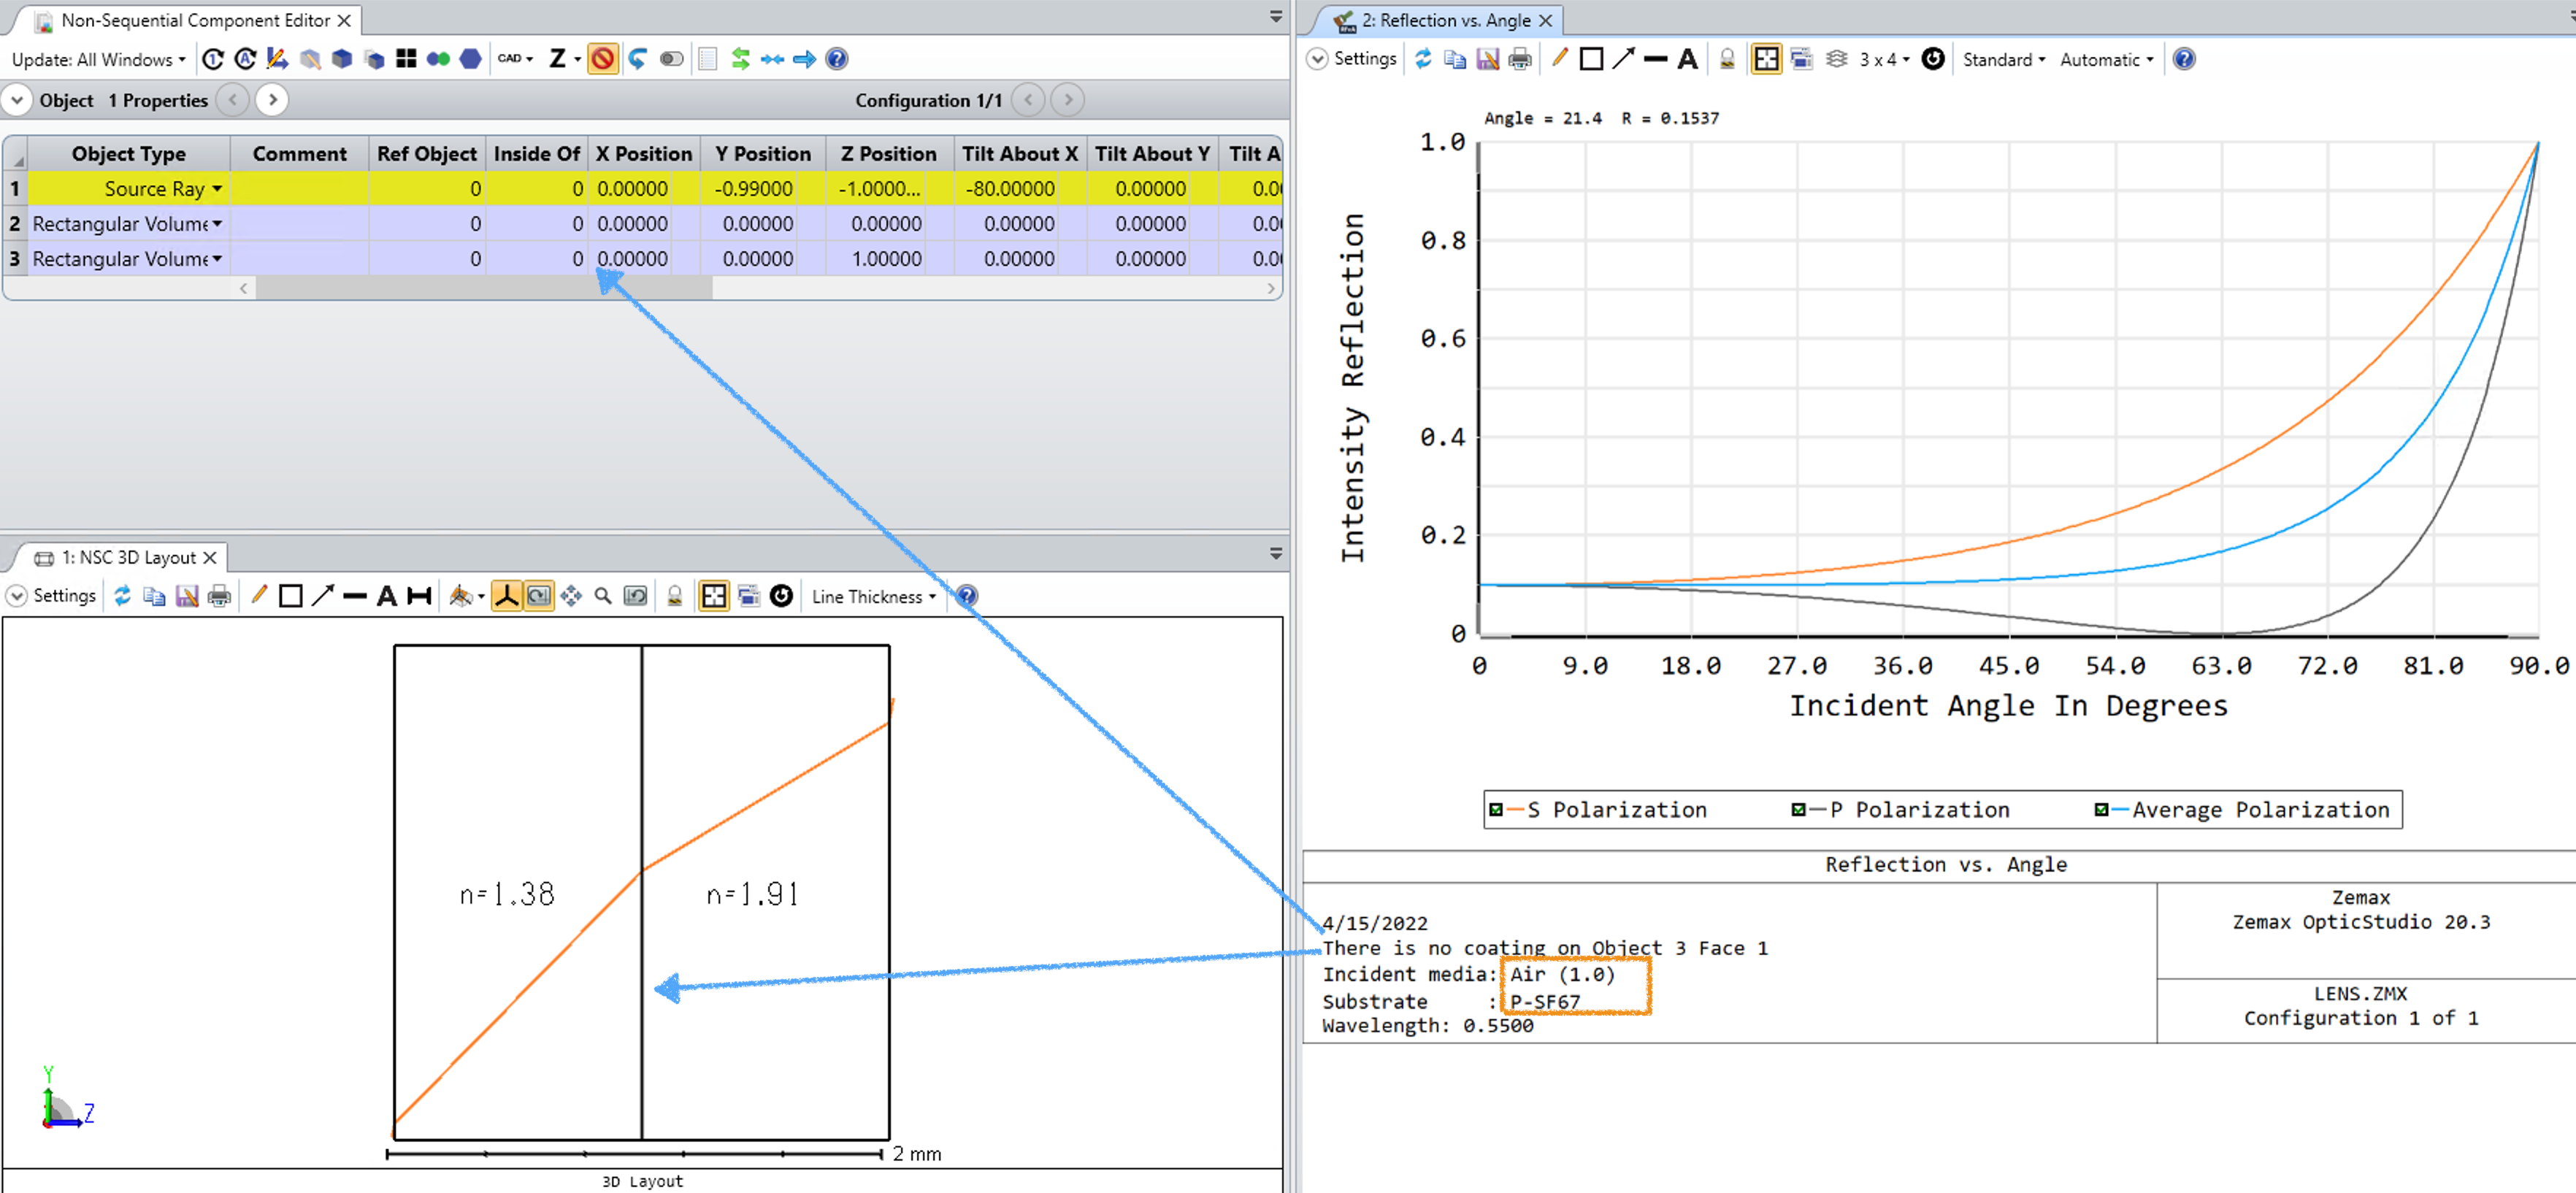
One thing to add to @Jeff.Wilde’s comment for Non-Sequential mode is to be extra careful when looking at the Fresnel transmission/reflection for “glued” objects. When using any of the 12 Coating analysis in NSC, OpticStudio will use the selected substrate as either n1 or n2 and will use the Inside Of column as the other index. So, even if you have a glued doublet where n1>1 and n2>2, OpticStudio by default will treat the incident media as Air. Based on which side of the doublet you want (if you want the front side of the doublet, you will have to put a dummy volume representing the back side of the doublet higher in the NCE and then make the Inside Of reference this dummy volume), you might have to modify your NCE specifically for this analysis and then undo the modifications for other analysis (note that Sequential mode does not have this restriction):
Ok thanks , I was wondering why my plots always indicated air as incident medium.
Now there is a little detail i didn’t understand properly: is the specification of the “Inside of “ field necessary also to perform ray tracing or just to calculare reflectance and transmittance? I mean, I’m working with Rectalgular Volumes glued one next to the other and at the moment I’m not specifying the “inside of option”. Are rays traced correctely accounting the propagation from one medium to the next one (and viceversa in case of reflections) or for example a thin layer of air is always considered and I should change everything in my analysis?
Hi Nicola,
The Inside Of isn’t required for normal ray tracing. If 2 objects are within the Glue Distance (defined in System Explorer > Non-Sequential > Glue Distance in Lens Units), then the non-sequential ray tracer will treat them as glued in terms of Snell’s Law. The Glue Distance is a key component to the Nesting Rule (the Help Files has a good entry discussing this concept).
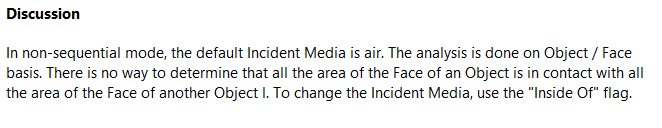
The primary purpose of the Inside Of column is for Sources that do not originate in air; by default OpticStudio assumes rays that are not in a medium begin propagation in air. Therefore, Sources will always launch their rays with n1 = 1.0. However, if the source is submerged, you need to use the Inside Of to tell OpticStudio the propagation medium is not air.
For your case, you do not need to change the Inside Of column for ray tracing, only for the Transmission/Reflection plots.
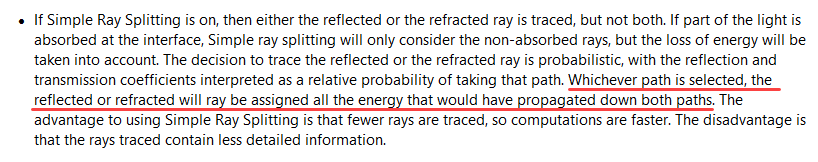
Just another detail. I’m working with the “simple ray splitting” option, which, if i’m not wrong, transmits or reflects a ray according to a probabilistic extimation based on “the material reflectance”. Now, is this material reflectance the correct one, corresponding to the considered interface, or not?
**EDITED (see light gray and bold)**
Hi Nicola,
The Simple Ray Splitting modifies both the probability and intensity of a transmitted or reflected ray. If you take a simple example of uncoated N-BK7, there is a 4% Fresnel reflection. Therefore, if you trace 25 rays, statistically you’ll have 24 rays transmitted at a total of 0.96 intensity and 1 ray reflected at a total of 0.04 intensity; 25 rays in and 25 rays out (each ray has 0.04 of the total launched intensity).
So yes, the Fresnel reflection from the original question determines the probability that both a ray will transmit/reflect and the intensity of that ray.
Actually, with “Simple Ray Splitting” turned on, both the transmitted and reflected rays have the same intensity. It’s just the case that the number of transmitted rays versus the number of reflected rays is chosen to statistically mimic the intensity transmission/reflection coefficients (which works well for a large number of rays).
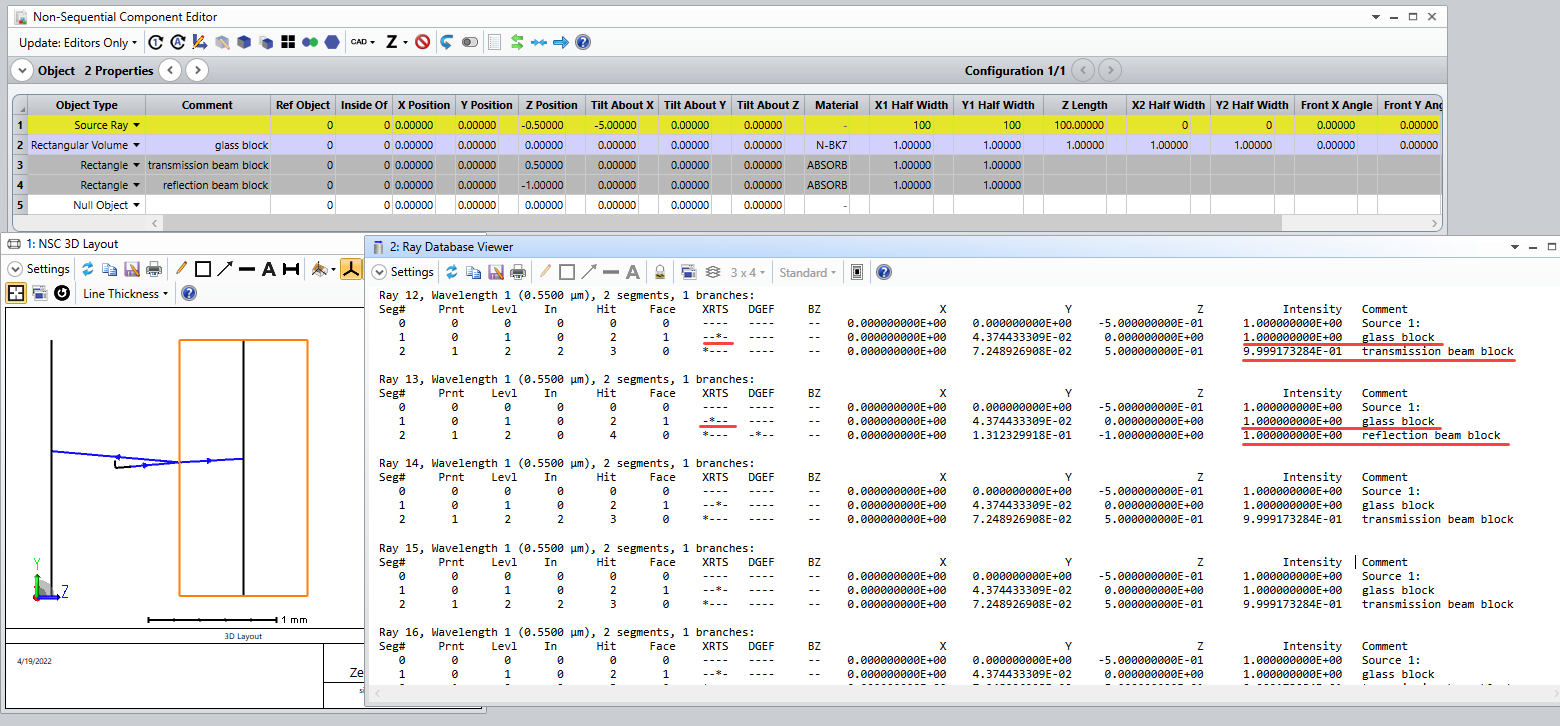
Here is a simple demonstration model. 100 source rays are launched at a bare glass interface; each ray has unit intensity. Two beam block surfaces are used, one inside the glass block to stop the transmitted rays, and another outside the block in air to stop the reflected rays. From the ray database file we see that the transmitted and reflected rays leaving the air/glass interface have the same intensity (however, the transmitted rays, after propagation to the internal beam block have a slightly lower intensity because BK7 has a small absorption coefficient).
Lastly, as @MichaelH notes, ray tracing in non-sequential mode does not require use of the “Inside Of” setting for proper results (independent of the simple ray splitting flag status). It is only needed for the coating transmission/reflection plots because, as indicated in the help documentation for these curves:
@Jeff.Wilde thanks for catching my incorrect statement. I have edited the reply so it won’t be misused by future customers.
I was getting confused with a quick test forgetting that each ray’s intensity is Total Power/Launched Rays so of the 25 launched rays, the 1 reflected ray only gave 0.04 irradiance and 24 transmitted rays gave 0.96 irradiance.
No problem. Your previous comment/example about use of the Inside Of flag was good. I noticed that the help documentation only recently added this detail. :)
Can someone confirm that thos analysis are not available in the ZOS-API ? I couldn’t find them in the API docs
Hi @mocquin, yes, you are correct, these analyses are not available in the ZOS-API. If you’re in sequential mode, you can use the CODA Merit Function Editor operand to extract the same information. For example, if you want to reproduce the Reflection vs Angle analysis, you can use CODA with Data = +1 for P Polarization, Data = -1 for S Polarization, and SUMM/PROB to take the average. I use a plane plate for S1, set the field to 2 and then use the Universal Plot (bottom left) to scan from 0deg to 89deg and this has agreement with the built-in analysis (bottom right).
@MichaelH thanks that helps, I’ll keep this for later - unfortunately I work mostly in NS mode these days