Solved

Plotting ray coordinates as function of the object field


AminR
Forum|alt.badge.img+1

Hi,

By this question I am trying to understand how Zemax and in general how raytracing and geometrical optics work.

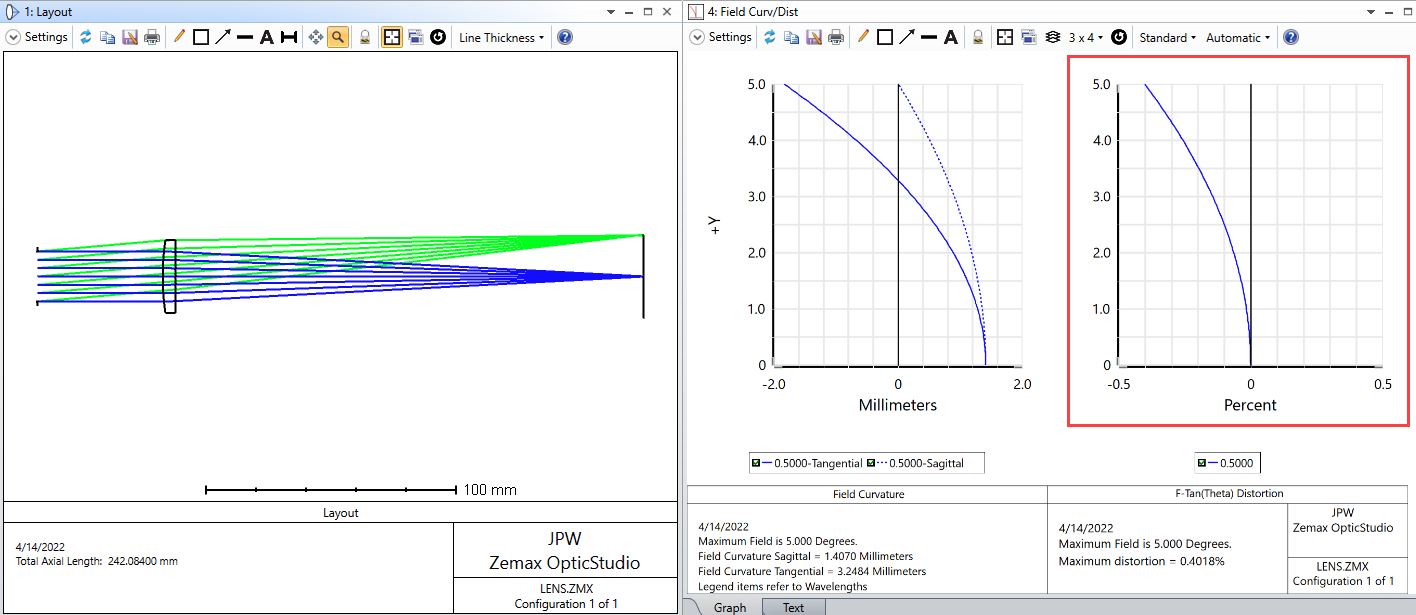
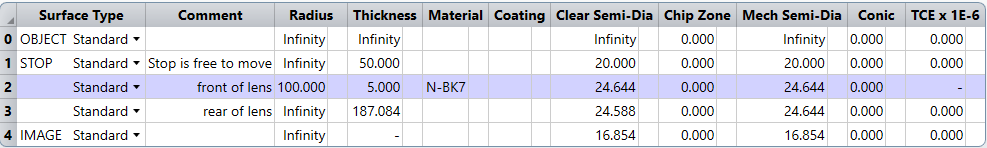
As part of my learning ZOS-API, I am trying to raytrace as a function of hy (normalized field coordinates along y-axis) at px = py =0 for a lens with the specs below

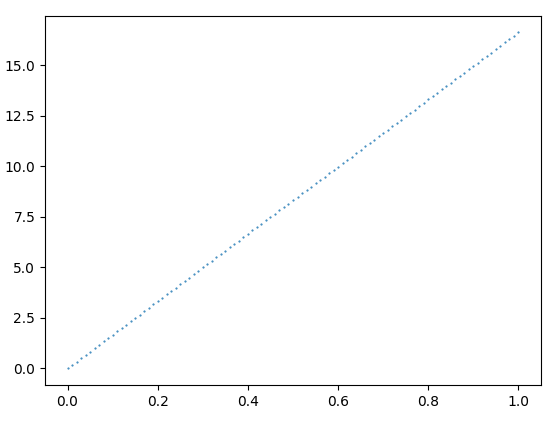
OpticStudio can plot the ray coordinates as function of entrance aperture but here I am trying to plot the ray coordinates as function of field coordinates). When the px = py =0, so the aperture dependent terms will be zero and only the Distortion terms (nonlinear field-dependent terms) are present. However, raytracing with Zemax (I use ZOS-API) results a plot like this (x-axis is the 0 < hy < 1 and y-axis is the ray coordinates.

My Question

Why this plot is linear and non-linear terms are absent? I found that by changing the px and py values this plot does not change a lot.


Here is the important parts of my Python code based on ZOS-API. After the lens and aperture are created a QuickFocus is run to put the image plane at the lens focus.


max_rays = 100
px = 0.0
py = 0.0
hx = 0.0
hy = np.linspace(0,1,max_rays)
for i in range(0 , max_rays):
    RayTraceData.AddRay(1, hx, hy[i], px, py, Enum.Parse(ZOSAPI.Tools.RayTrace.OPDMode, "None"))

raytrace.RunAndWaitForCompletion()

RayTraceData.StartReadingResults()


Best answer by Jeff.Wilde

It looks like your system has low distortion, less than -0.5%, which you can see by using the Field Curv/Dist analysis:


So, what appears to be a straight line for the chief ray intercept in the image plane should actually have a small degree of non-linearity (relative to the f*tan(theta) reference displacement for an ideal lens).  By the way, you can also easily generate the same plot using the Universal Plot tool:


Hope this helps...

View original
Did this topic help you find an answer to your question?

2 replies

Jeff.Wilde
Luminary
Forum|alt.badge.img+3
  • Luminary
  • 490 replies
  • Answer
  • April 15, 2022

It looks like your system has low distortion, less than -0.5%, which you can see by using the Field Curv/Dist analysis:


So, what appears to be a straight line for the chief ray intercept in the image plane should actually have a small degree of non-linearity (relative to the f*tan(theta) reference displacement for an ideal lens).  By the way, you can also easily generate the same plot using the Universal Plot tool:


Hope this helps...


AminR
Forum|alt.badge.img+1
  • Author
  • Monochrome
  • 2 replies
  • April 19, 2022
Jeff.Wilde wrote:

It looks like your system has low distortion, less than -0.5%, which you can see by using the Field Curv/Dist analysis:


So, what appears to be a straight line for the chief ray intercept in the image plane should actually have a small degree of non-linearity (relative to the f*tan(theta) reference displacement for an ideal lens).  By the way, you can also easily generate the same plot using the Universal Plot tool:


Hope this helps...

Thanks Jeff. You are right!


Reply


Cookie policy

We use cookies to enhance and personalize your experience. If you accept you agree to our full cookie policy. Learn more about our cookies.

 
Cookie settings