Solved

Diffraction Limit FFT MTF data via ZOS-API ?

  • October 10, 2022
  • 5 replies
  • 354 views

  • Ultraviolet
  • 27 replies

Hello all,

How to extract the diffraction limited spatial frequency values in tangential/sagittal planes for FFT-MTF?

I am unable to find a reference to this in the ZOS-API interface documentation. Additionally, how to do the same in a ZPL?

Cheers


Best answer by David.Nguyen

Hi Asuku,


The diffraction limited data will be stored as the first DataSerie in the result interface.

Here is a simple example that demonstrates how to plot FFT MTF data (this is inspired from Example 23 in the Syntax Help File), this file is also attached to my reply:
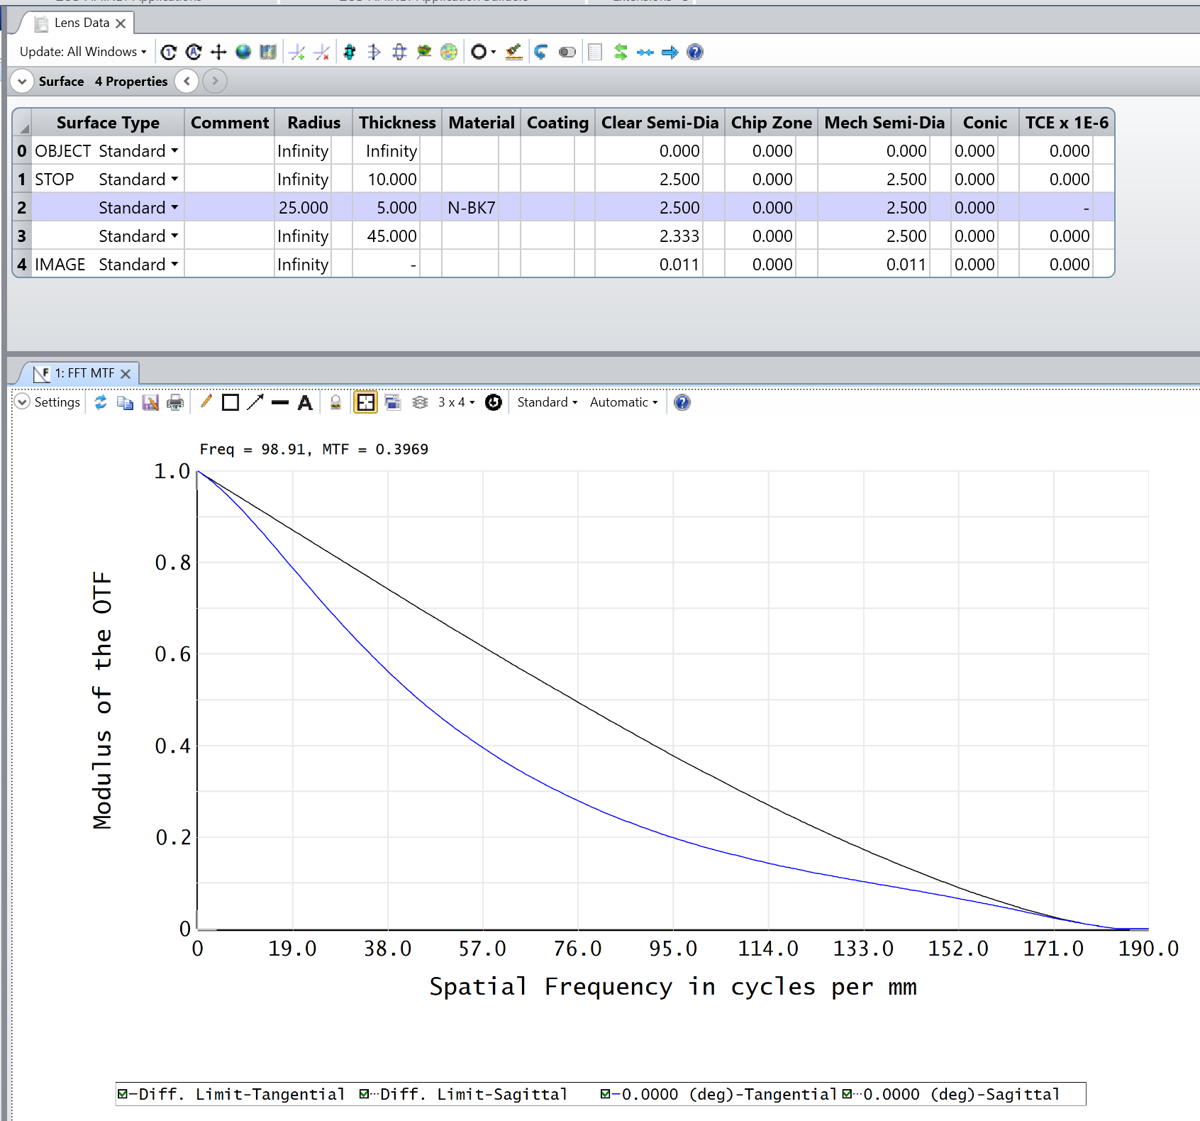
Here is the Python code to reproduce a similar plot (only with the tangential component) in an Interactive Extension:

import numpy as np
import matplotlib.pyplot as plt


# Open FFT MTF
my_fft_mtf = TheSystem.Analyses.New_FftMtf()

# Get FFT MTF settings
fft_mtf_settings = my_fft_mtf.GetSettings()

# Show diffraction limit
fft_mtf_settings.ShowDiffractionLimit = True

# Run FFT MTF
my_fft_mtf.ApplyAndWaitForCompletion()

# Get FFT MTF results
fft_mtf_results = my_fft_mtf.GetResults()

# Check how many data series are available
print('Number of data series = ' + str(fft_mtf_results.NumberOfDataSeries))

# First data serie: diffraction limit
data_1 = fft_mtf_results.GetDataSeries(0)

x_1 = np.asarray(tuple(data_1.XData.Data))
y_1 = np.asarray(tuple(data_1.YData.Data))
# Side note: this splits between tangential and sagittal data series
y_1 = y_1.reshape(data_1.YData.Data.GetLength(0), data_1.YData.Data.GetLength(1))

# Second data serie: actual FFT MTF
data_2 = fft_mtf_results.GetDataSeries(1)

y_2 = np.asarray(tuple(data_2.YData.Data))
y_2 = y_2.reshape(data_2.YData.Data.GetLength(0), data_2.YData.Data.GetLength(1))

# Plot data series (only tangential)
plt.figure()
plt.plot(x_1, y_1[:, 0], 'r', label='Diffraction limit')
plt.plot(x_1, y_2[:, 0], 'c', label='FFT MTF')
plt.legend()
plt.show()

# Close FFT MTF
my_fft_mtf.Close()

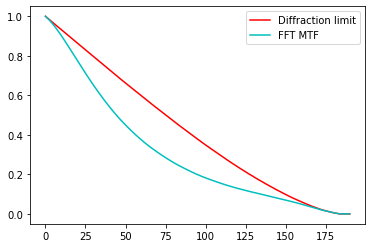
This is what it plots:

I did not double-check that I was indeed plotting the tangential and not sagittal data so better double-check, but I think you get the idea.

Take care,


David

View original
Did this topic help you find an answer to your question?

5 replies

David.Nguyen
Luminary
Forum|alt.badge.img+2
  • Luminary
  • 1089 replies
  • Answer
  • October 11, 2022

Hi Asuku,


The diffraction limited data will be stored as the first DataSerie in the result interface.

Here is a simple example that demonstrates how to plot FFT MTF data (this is inspired from Example 23 in the Syntax Help File), this file is also attached to my reply:

Here is the Python code to reproduce a similar plot (only with the tangential component) in an Interactive Extension:

import numpy as np
import matplotlib.pyplot as plt


# Open FFT MTF
my_fft_mtf = TheSystem.Analyses.New_FftMtf()

# Get FFT MTF settings
fft_mtf_settings = my_fft_mtf.GetSettings()

# Show diffraction limit
fft_mtf_settings.ShowDiffractionLimit = True

# Run FFT MTF
my_fft_mtf.ApplyAndWaitForCompletion()

# Get FFT MTF results
fft_mtf_results = my_fft_mtf.GetResults()

# Check how many data series are available
print('Number of data series = ' + str(fft_mtf_results.NumberOfDataSeries))

# First data serie: diffraction limit
data_1 = fft_mtf_results.GetDataSeries(0)

x_1 = np.asarray(tuple(data_1.XData.Data))
y_1 = np.asarray(tuple(data_1.YData.Data))
# Side note: this splits between tangential and sagittal data series
y_1 = y_1.reshape(data_1.YData.Data.GetLength(0), data_1.YData.Data.GetLength(1))

# Second data serie: actual FFT MTF
data_2 = fft_mtf_results.GetDataSeries(1)

y_2 = np.asarray(tuple(data_2.YData.Data))
y_2 = y_2.reshape(data_2.YData.Data.GetLength(0), data_2.YData.Data.GetLength(1))

# Plot data series (only tangential)
plt.figure()
plt.plot(x_1, y_1[:, 0], 'r', label='Diffraction limit')
plt.plot(x_1, y_2[:, 0], 'c', label='FFT MTF')
plt.legend()
plt.show()

# Close FFT MTF
my_fft_mtf.Close()

This is what it plots:

I did not double-check that I was indeed plotting the tangential and not sagittal data so better double-check, but I think you get the idea.

Take care,


David


  • Author
  • Ultraviolet
  • 27 replies
  • October 13, 2022

Hello David,

Thanks for advice. I tried to run your code on the zos file you provided. However, I don’t see any data series for diffraction limit even though fft_mtf_settings.ShowDiffractionLimit = True

As you can see below, data_1 contains the actual Field == 1 data only (see plot below which shows Field ==1 data instead of diffraction limit data).

Also note that data_2 array = empty.

fft_mtf_results.NumberOfDataSeries == 1 (this shows that there is only one MTF series output) 


Note: I am running Zemax 22.2.1


Thanks - A


David.Nguyen
Luminary
Forum|alt.badge.img+2
  • Luminary
  • 1089 replies
  • October 13, 2022

Hi Asuku,


What is your version of Pythonnet? If it is after 2.5.2, can you try 2.5.2 to see if it makes a difference? I’ve seen quite some strange issues lately with people using Pythonnet 3.0.0 and above.

Take care,


David


  • Author
  • Ultraviolet
  • 27 replies
  • October 14, 2022

yes, it was > 2.5.2.

pythonnet → 3.0.0.post1 

I downgraded to:

pythonnet → 2.5.2

Now I am able to replicate your process successfully without errors. Are there any other problems caused by pythonnet that I need to be aware of when developing on ZOS-API Python?

Thanks a lot for your help.

Best - Auku


David.Nguyen
Luminary
Forum|alt.badge.img+2
  • Luminary
  • 1089 replies
  • October 14, 2022

Hey Asuku,


I never had any issues with 2.5.2 before. I think it is only an issue with more recent versions of Pythonnet.

Take care,


David


Reply


Cookie policy

We use cookies to enhance and personalize your experience. If you accept you agree to our full cookie policy. Learn more about our cookies.

 
Cookie settings