
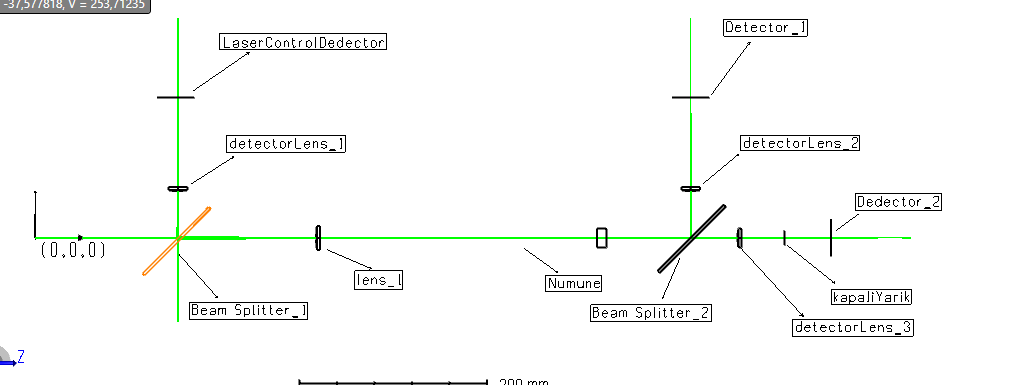
Hi, I am trying to simulate the Z-Scan experiment with Zemax, but I need a macro program. I am sharing the experimental setup. It will move the piece used as a sample from 400mm to 600mm, and in the meantime, I need to reach the normalized transmittance value from the detectors. This will be graphed later, and how can I write a macro for this? I'll be happy if you can help me.
# Numune number
numune = 4
# dedector number
laserDedector = 5
dedector_1 = 6
dedector_2 = 7
# Minimum Z position
z_min = 400
# Maximum Z position
z_max = 600
# Z range
z_range = z_max - z_min
# Number of samples
samples = 10
# Z step size
z_step = z_range / ( samples - 1 )
# Z position array
DECLARE z_position, DOUBLE, 1, samples
DECLARE transmittance, DOUBLE, 1, samples
# Loop over the different Z positions
FOR z_indx, 0, samples-1, 1
# Calculate new Z position
z_pos = z_indx * z_step + z_min
z_position(z_indx+1) = z_pos
# Update detector Z position
SETNSCPOSITION 1, numune, 3, z_pos
# Clear detectors
clear = NSDD(1, 0, 0, 0)
# Raytrace
NSTR 1, 0, 0, 0, 1, 1, 0
# transmittance
transmittance(z_indx+1) = NSDD(1, 6, 1, 1)
NEXT
# Plot
PLOT NEW
PLOT TITLEX, "Z Position"
PLOT TITLEY, "Transmittance"
PLOT FORMATX, "%2.1f"
PLOT DATA, z_position, transmittance, samples, 1, 0, 0
PLOT GO
What I have done so far is as mentioned above