Detailed Problem Description:
Hi
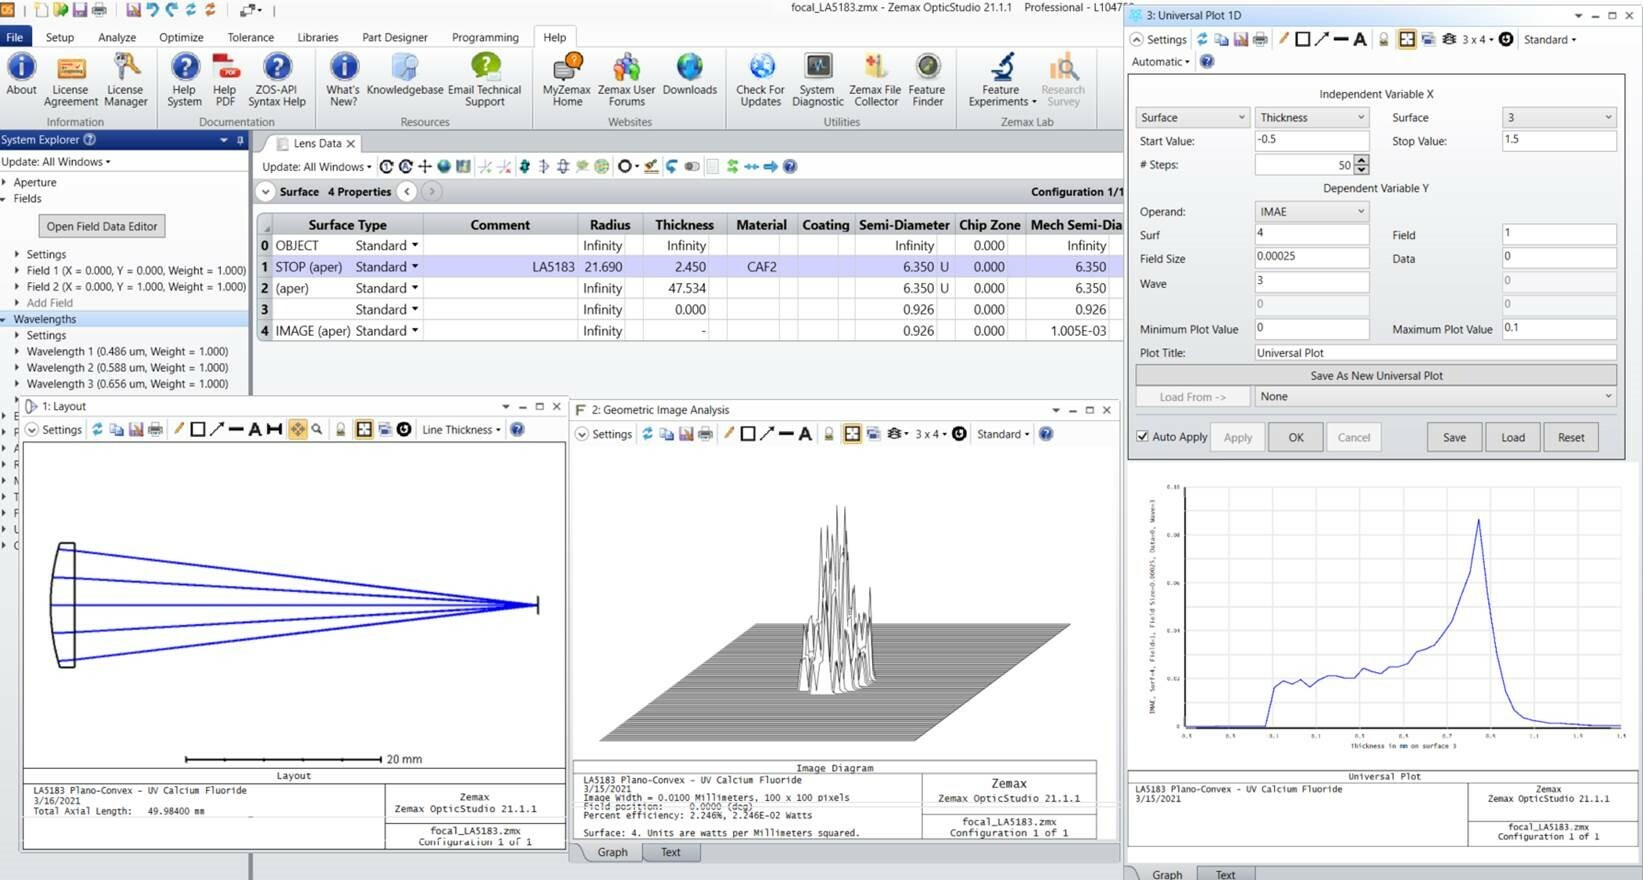
I am trying to get the variation of total irradiance at different z around focus for a singlet lens (with a plan to use the same to a complicated system). The variation is supposed to be of Gaussian shape with sharp peak position at the best focus for a particular wavelength. Also, due to chromatic aberration, such plot will give different peak positions for different wavelengths. As Geometric image analysis provides percentage efficiency at a fixed z, universal plot for operand IMAE vs thickness of penultimate surface should provide such Gaussian plot. However, I am not getting such shape, rather a distorted peak. Please let me know the correct procedure for getting such a plot (i.e. total irradiance vs z). Any other method for this will also be helpful.