
Retrieving Vignetting Data from Vignetting Analysis via ZOS.API with Python

  • December 31, 2020
  • 1 reply
  • 164 views

Dear all,

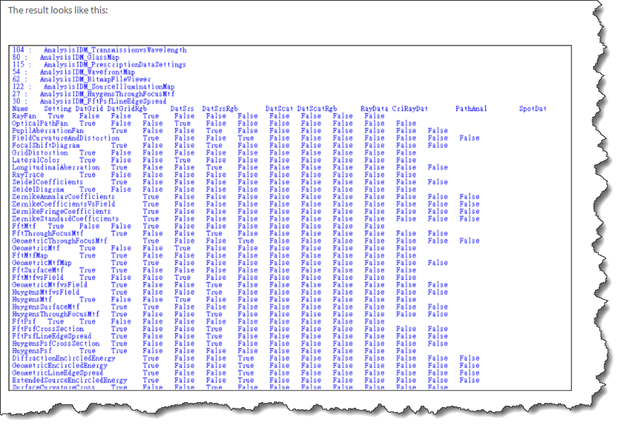
in progress of fully automating my data export  for my customized documentation, I am trying to access the data generated by the Zemax analysis windows by a standalone API application in python. While this works for most of the analysis, I am having trouble to get data from the vignetting window for further processing by using the GetResults() function. There is not data retrieved. Debugging shows, that there is indeed no data listed in the respective item.

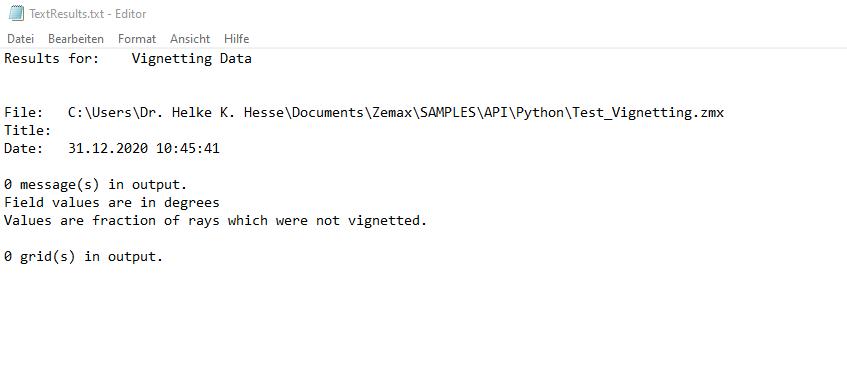
I double checked by exporting the data to a text file - this is also empty with respect to data.


My Code therefore  (simple example based on the available python api example 1) works as follows:

vig = TheSystem.Analyses.New_Analysis(ZOSAPI.Analysis.AnalysisIDM.VignettingDiagramSettings)
vig.WaitForCompletion()
vig.ToFile(sampleDir + '\\API\\Python\\TextResults.txt')

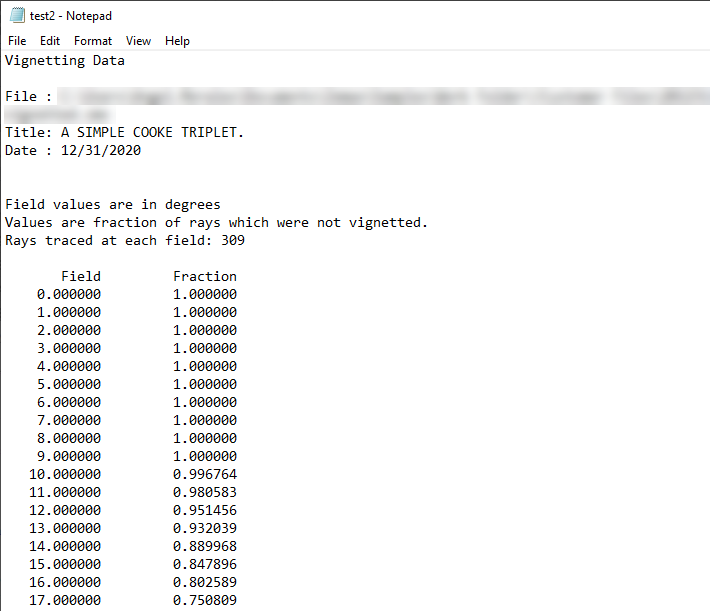
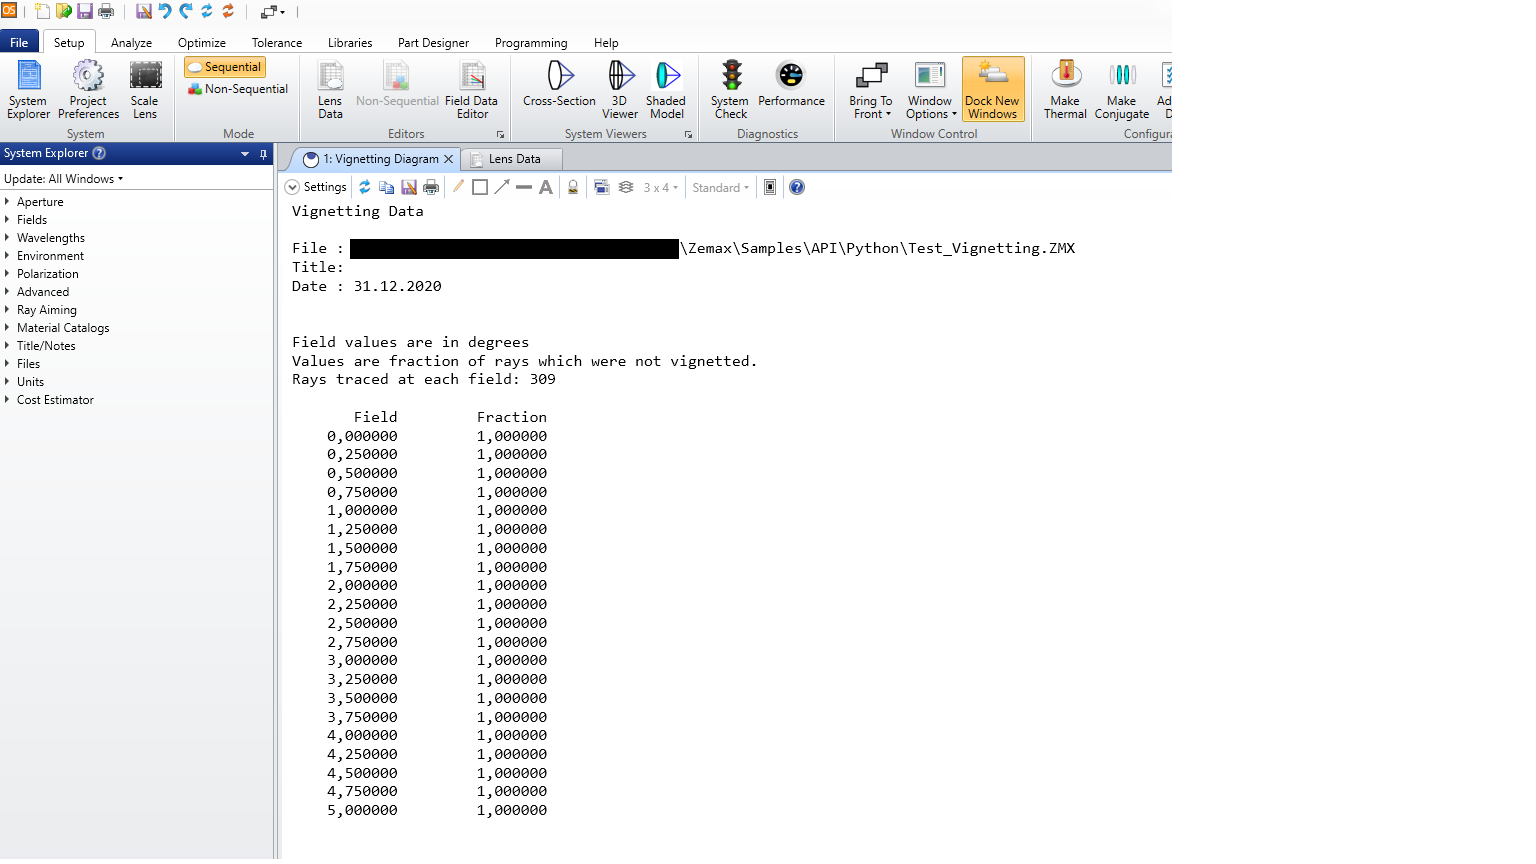
However, when I save the lens file, and reopen with a Zemax Instance, the vignetting window is displayed correctly and the text-form thereof shows data as it should.

I attach the python code file, which works when started from the API samples folder (C:\Users\UserName\Zemax\ZOS-API Sample Code\Python) after having run sample 1.

I there a bug in my procedure or is this just not working for this specific type of analysis?

Thank you very much for your help!


Did this topic help you find an answer to your question?

1 reply

Angel Morales
En-Lightened
Forum|alt.badge.img+1
  • En-Lightened
  • 203 replies
  • December 31, 2020

Hi Karen,

Thanks for your post here!

The issue you're running into is that the Vignetting Diagram analysis doesn't currently store data in any of the data types that the ZOS-API supports. That is, it doesn't store data into DataGrids, DataSeries, etc. Though most analyses do utilize these data structures, not all of them do, and for those that don't, you'll need to use GetTextFile() to obtain the numerical data from the analysis. We actually have a Knowledgebase article here that shows how to use Python or MATLAB to see what kind of data structures that any given analysis supports, if any:


I should note that if you refer to the Python code here, it is using the .COM interface, which has been replaced by .NET as of OpticStudio 20.2. The main difference for the provided code is that the enumeration in .NET will be handled differently from .COM -- you can read about the differences in this forum post.

Since the Vignetting Diagram doesn't support any of these data types (which is why we see a message like '0 grid(s) in output'), you'll need code that looks more like:
 

vig = TheSystem.Analyses.New_Analysis(ZOSAPI.Analysis.AnalysisIDM.VignettingDiagramSettings)
vig.WaitForCompletion()
vig_Res = vig.GetResults()
vig_Res.GetTextFile(**Directory for file**)

The saved .TXT file will then be the raw output of the Text tab from the analysis:


Let us know if you have any further questions here!

~ Angel


Reply


Cookie policy

We use cookies to enhance and personalize your experience. If you accept you agree to our full cookie policy. Learn more about our cookies.

 
Cookie settings