This is definitely a bug for the ZOSAPI.Analysis.AnalysisIDM.GeometricImageAnalysis feature, but maybe not for the obvious reason.
What MinX and MinY are supposed to give is the physical coordinate of the “bottom left pixel” of the DataGrid (remembering that this is actually grid.Values[0, 0] and you’ll need to perform a flipud to get it in the same orientation as OpticStudio). So, if you are using a WavefrontMap, MinX=-1 and MinY=-1 because of the normalized pupil but if you’re using FftPsf, then this value would be in microns. To get the width and right most pixel value, you could use something like:
width = grid.Dx * grid.Nx
right = grid.MinX + width
where Dx is the delta between pixels in the x direction and Nx is the number of pixels in the x direction.
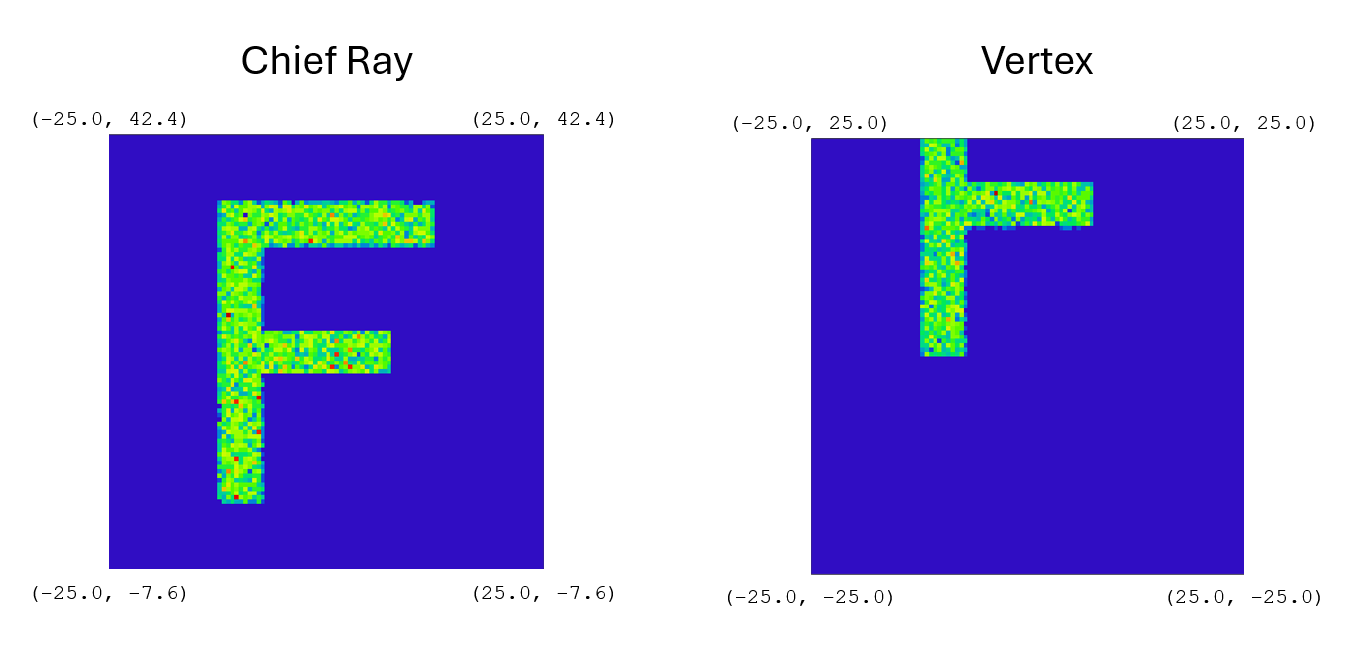
The IAR_ interface reads the ZDA file structure and populates the fields accordingly (there is no additional calculations performed in the ZOS-API...it simply “reads” the data being passed out of the core code). Comparing the Text Tab for both the FFT PSF and the Geometric Image Analysis, it looks like the core code for FFT PSF actually calculates things like Dx and Reference Coordinate (to get calculate MinX). However, for Geometric Image Analysis, the core code doesn’t pass back a corresponding value for the Reference Coordinate. The Reference Coordinate is needed to get the physical MinX and MinY values. The Reference Coordinate value is determined by the IAS_GeometricImageAnalysis.Reference property and can be:
- ChiefRay (REAX/REAY)
- Vertex (GLCX/GLCY)
- Primary Chief (REAX/REAY)
- Centroid (CENX/CENY)
You can get the values for the Reference Coordinate by using the MFE operands in parenthesis. The Nx and Dx values for GeometricImageAnalysis are correct, so with the calculated Reference Coordinate, you can get the correct MinX and MinY values.
Since the Geometric Image Analysis doesn’t provide a Reference Coordinate in the ZDA, I would file a bug report with the ACE team. The MinX and MinY values should be set to NaN so improper conclusions are not drawn by the engineer.