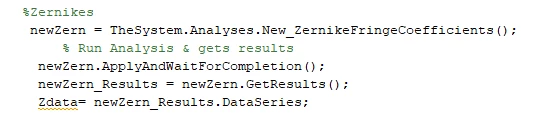
I am trying to view/export the zernike data of my system using Matlab and the API. Currently my code reads:
And I don't know what to do from here. The data comes to Matlab in an IAR file type, and I don't know how to extract it.
Thanks,
Stephen Chapman
Page 1 / 1
Hi Stephen,
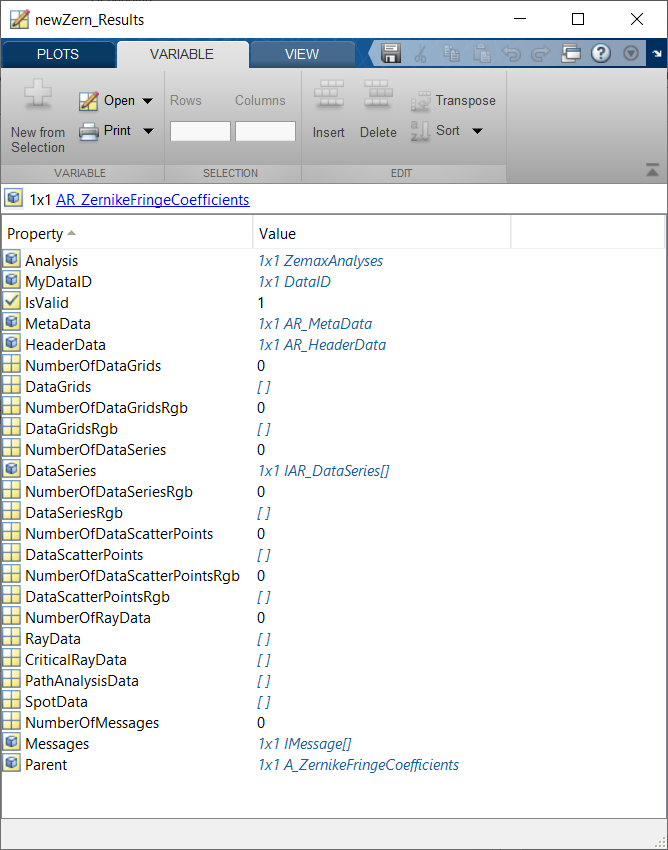
Currently, the Zernike analyses do not have a Data Series or Data Grid available to them. There are a few ways to confirm this, but my favorite way is to investigate the newZern_Results object with a breakpoint. I've shown what that looks like in the Forum post 'How to extract the result of ImageSimulation in ZOS-API.' When we investigate it, we see that each analysis data type has a '0' next to it. This means that there is no data to retrieve:
At this point, you have two options. The most straightforward is to extract the data by using the property GetTextFile. This command will generate a text file with a user-defined filename, which will match the output you see under the 'Text' tab of the Zernike Fringe Coefficients analysis window. Once the text file is generated, you can use Matlab to parse it for the coefficient values.
Alternatively, you could use the ZERN optimization operand. This operand will be able to pull the same values you see in the Zernike Fringe Coefficients tool. I previously wrote an example of this procedure for the Zernike Standard Coefficients. You can find it below:
% Declare operand settings
term = 4;
pwave = 0;
for a = 1:TheSystem.SystemData.Wavelengths.NumberOfWavelengths
if TheSystem.SystemData.Wavelengths.GetWavelength(a).IsPrimary
pwave = a;
end
end
sample = 2;
field = 1;
% Choose the Zernike type we're lookiing at
% 0 = Fringe, 1 = Standard, 2 = Annular
type = 1;
epsilon = 0;
vertex = 0;
% Get operand value
testVal = TheMFE.GetOperandValue(ZOSAPI.Editors.MFE.MeritOperandType.ZERN, term, pwave, sample, field, type, epsilon, vertex, 0);
Using the function GetOperandValue, we can extract any optimization operand value without including it in the Merit Function. In the above code, I am pulling the 4th Zernike Standard Coefficient term into Matlab. You’ll see by the variables I’ve declared that this operand asks for the term of interest, wavelength, sampling rate, field, and type:
Using the above, you could write a loop to cycle through the Zernike terms and store them as an array in Matlab. This method will pull the same terms you see within the Zernike coefficient analysis you’re using (assuming all settings are the same). This will take a little longer than simply pulling the text file of data, but will leave you with a Matlab-native object of double-precision values.
Let me know if you have any questions about this!
Best,
Allie
PS: That's a great icon you have. Corgis are the best!
Thanks Callie for this reply. This saved me a bunch of time trying to figure this out. Love the idea of using MFE operands for this rather than saveing the text file.
Hi,
I was following this very useful example to extract Zernike terms, but found discrepancies with what OpticStudio is calculating in the Zernike window. The problem seems to be that retrieving terms 1-11 uses 11 terms fitting, while 12-36 use 36 terms fitting, so I cannot retrieve a consistent set of terms (i.e. from the same fitting).
In the MFE, the fitting is done according to the highest term in the editor, but here apparently every call to GetOperandValue() performs the fitting from scratch, making the entire procedure not consistent for terms > 11.
Is there any way around this?
Thanks,
Paolo
Hi Paolo,
You’re absolute correct about both the MFE being correct and the GetOperandValue() being incorrect. To get around this, you will have to manually build up the MFE.
As a little background, the Zernike algorithm is a regressive fitting algorithm where lower values are dependent on the maximum term defined (you can think of this as balancing low order terms with higher order terms if you define a higher order term with the maximum term number). Zernike terms are similar to wavefront coefficients in that they are grouped around a rho^n term. So, when you are looking at fitting a wavefront/surface to Zernikes, you need to make sure you use the appropriate rho^n maximum term. Looking at the Zernike Standard Coefficients, the rho^n term always increases when moving to the next spherical term, namely:
Z4 (2nd order)
Z11 (4th order)
Z22 (6th order)
Z37 (8th order)
Z56 (10th order)
Z79 (12th order)
Z106 (14th order)
Z137 (16th order)
The maximum term should always be 1 less than the next highest order you want to investigate. So, if you want to decompose a wavefront/surface to 3rd order wavefront coefficients, you will need to include all the terms of the rho^4 Zernikes meaning the maximum term should be Z21.
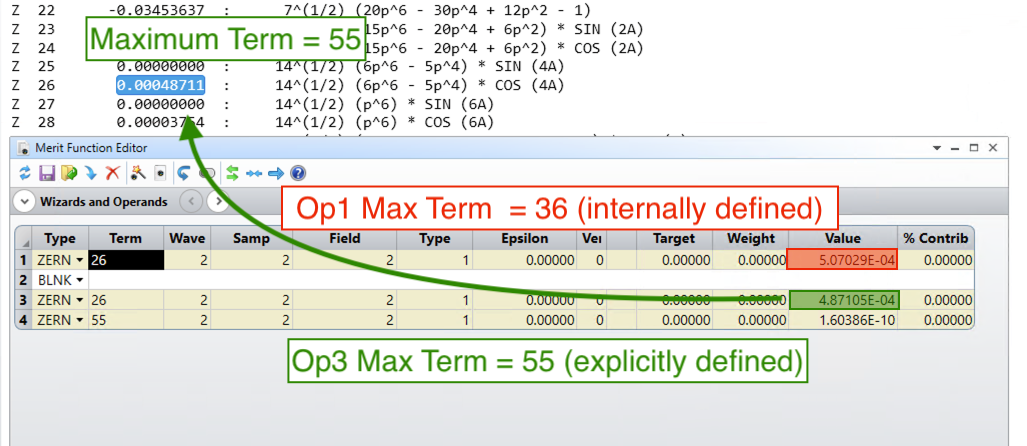
The Merit Function Editor recognizes the maximum term for adjacent ZERN operand, using the maximum term as described above. So, to keep the fitting algorithm consistent while extracting different terms, you will need to insert (at least) 2 new operands in your MFE, the first operand will be the ZERN that you want to extract and the second operand will be the ZERN that will define the maximum fitting term. I would suggest adding all your terms to the MFE so the Zernike fitting would only have to occur once.
The ZOS-API Sample Code Example 3 shows how to add new operands and change the type as a quick example if you need a starting point.
~Michael
M,
Are you suggesting:
Create entries in the MFE and then use GetOperandValue, or
Create entries in the MFE and then get the value of the MFE
Doing (2) will return the absolute value of the coefficient and you won’t know the sign of the coefficient.
-B
Hey Brian,
It’s slightly different from both options you mention.
Create entries in the MFE, update the MFE, and then GetOperandAt(#).Value
The (slow) psuedo code would look like:
int wave = 2;
int samp = 2;      // 2 ^ (samp + 4) is the grid density
int field = 2;
int zType = 1;     // 0 = fringe, 1 = standard

int numOfTerms = 37;


IMFERow op;
for (int i = 1; i <= numOfTerms; i++)
{
    // get a reference to the operand...add a new row if needed
    if (i == 1)
    {
        op = TheSystem.MFE.GetOperandAt(1);
    }
    else
    {
        op = TheSystem.MFE.InsertNewOperandAt(TheSystem.MFE.NumberOfOperands + 1);
    }

    // change the operand type and add column values
    op.ChangeType(MeritOperandType.ZERN);
    op.GetCellAt(1).IntegerValue = i;
    op.GetCellAt(2).IntegerValue = wave;
    op.GetCellAt(3).IntegerValue = samp;
    op.GetCellAt(4).IntegerValue = field;
    op.GetCellAt(5).IntegerValue = zType;
}

// update the merit function
TheSystem.MFE.CalculateMeritFunction();

// puposely add an extra term so zernikes[1] = Z1
double[] zernikes = new double[numOfTerms + 1];

// get all the zernikes
for (int i = 1; i <= numOfTerms; i++)
{
    zernikes[i] = TheSystem.MFE.GetOperandAt(i).Value;
}
For #2, if you get the merit function value itself, as you pointed out it will always be positive and you can only get a single value at a time.
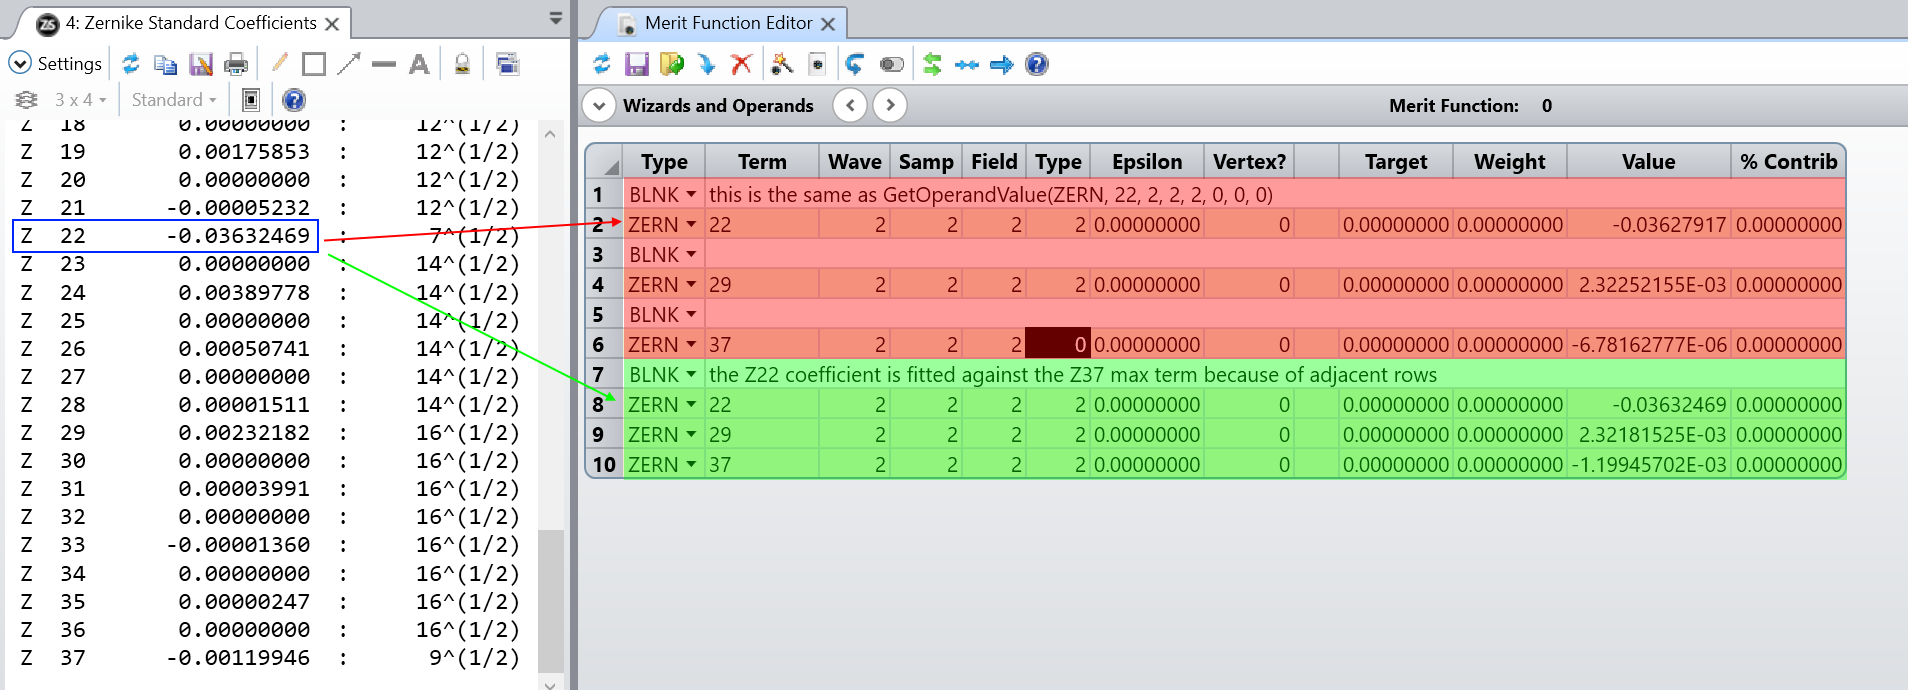
For #1, you cannot use the single line method GetOperandValue() since the Zernike will only consider terms lower than or equal to the term in question. For example, if you look at the Double Gauss 28 degree field.zmx sample file (wave 2, field 2), you can see that the Zernike Standard Coefficient report will give the following for Z22, Z29, Z37:
Z22 = -0.03632469
Z29 = 0.00232182
Z37 = -0.00119946
If you use the GetOperandValue(), this is equivalent to having a BLNK between different ZERN terms (in red below). When you look at Z22 with this method, only Z1 through Z22 are used in the Zernike fitting. Then when you look at the Z29, this looks at Z1 through Z29, but the Z22 will be different since the Zernike fitting is done to minimize the RMS error. In order to get the proper Zernike fitting, you will need to place all ZERN operands one next to the other, only increase the Term column, calculate the MFE and then retrieve each operand’s value (in green below).