Solved

ZOS-API Wavefront map populated by zeros


Hi Zemax community,

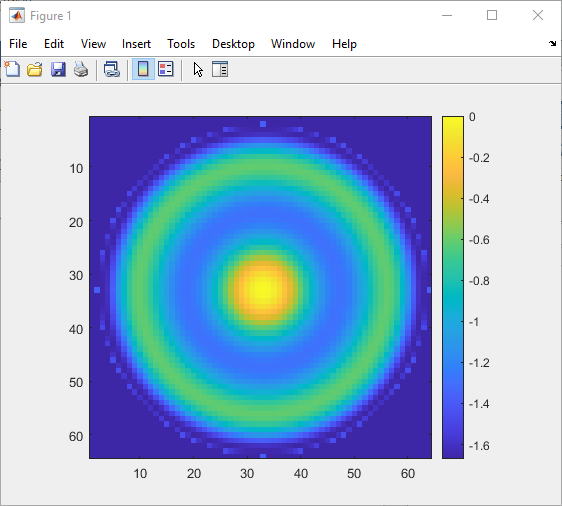
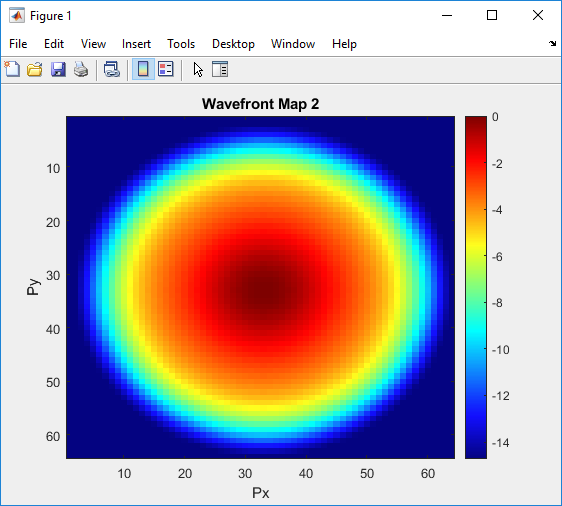
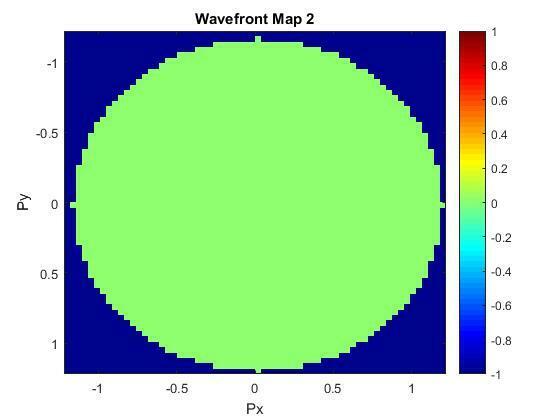
I am a student who is learning to use the ZOS API in Matlab and I’m having issues with getting results from New_WavefrontMap. How do I correctly pull data from a wavefront map? As the results I plot are always zero.

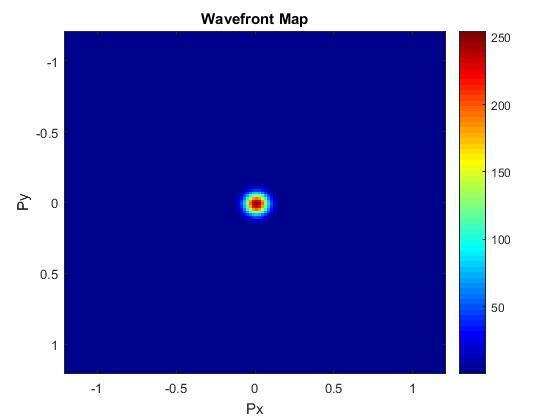
I am running a wavefront analysis and POP analysis in the same program, which uses the ‘Double Gauss 5 degree field.zmx’ file from samples. I apply the analysis then pull the results using the following code to get the data:

WF_Map_Data = New_WF_map_results.DataGrids(1).Values.double;

matrixData = POP_Results.DataGrids(1).Values.double;

and try to plot it in Matlab the matrix will be populated by zeros.

Wavefront map populated by 0’s

Both wavefront map and POP are set up in a similar fashion, but when plotting the results of the POP it will not be populated by zeros.

POP result

Thanks for reading

Nick

Best answer by Jeff.Wilde

I’m not sure why your wavefront data is all zeros.  Perhaps you can share more of your Matlab code?

When I use the same sample file, and run the following code, it seems to work okay:

% Create new wavefront analysis
New_WF_map = TheSystem.Analyses.New_WavefrontMap(); 

% Run Analysis & gets results
New_WF_map.ApplyAndWaitForCompletion();
WF_Map_Data = New_WF_map.Results.DataGrids(1).Values.double;

% plot results
figure, imagesc(WF_Map_Data), axis image 
colorbar


View original
Did this topic help you find an answer to your question?

3 replies

Jeff.Wilde
Luminary
Forum|alt.badge.img+3
  • Luminary
  • 491 replies
  • Answer
  • March 3, 2022

I’m not sure why your wavefront data is all zeros.  Perhaps you can share more of your Matlab code?

When I use the same sample file, and run the following code, it seems to work okay:

% Create new wavefront analysis
New_WF_map = TheSystem.Analyses.New_WavefrontMap(); 

% Run Analysis & gets results
New_WF_map.ApplyAndWaitForCompletion();
WF_Map_Data = New_WF_map.Results.DataGrids(1).Values.double;

% plot results
figure, imagesc(WF_Map_Data), axis image 
colorbar


Hi Jeff, thanks for your reply. Here are the parts of the code which take the wavefront analysis:

Creating the analyses and wavefront analysis are done through these lines

% Create analysis
    TheAnalyses = TheSystem.Analyses;
    New_WF_map = TheAnalyses.New_Analysis(ZOSAPI.Analysis.AnalysisIDM.WavefrontMap);


After creating the analysis the field and wavelength number are set to 1

    %Wavefront settings
    New_WF_Settings = New_WF_map.GetSettings();
    New_WF_Settings.Wavelength.SetWavelengthNumber(1);
    New_WF_Settings.Field.SetFieldNumber(1);


I then apply the analysis and grab the results

    % Run Analysis & gets results
    New_WF_map.ApplyAndWaitForCompletion();
    New_WF_map_results = New_WF_map.GetResults();


Then the results are plotted with the following code

    %Plot wavefront
    WF_Map_Data = New_WF_map_results.DataGrids(1).Values.double;
    figure
    imagesc(WF_Map_Data);
    colorbar;
    title('Wavefront Map 2')
    colormap(jet);
    xlabel('Px');
    ylabel('Py');


Jeff.Wilde
Luminary
Forum|alt.badge.img+3
  • Luminary
  • 491 replies
  • March 7, 2022

Looks fine to me.  When I run your code with the “Double Gauss 5 degree field.zos” lens I get the expected result:


Reply


Cookie policy

We use cookies to enhance and personalize your experience. If you accept you agree to our full cookie policy. Learn more about our cookies.

 
Cookie settings