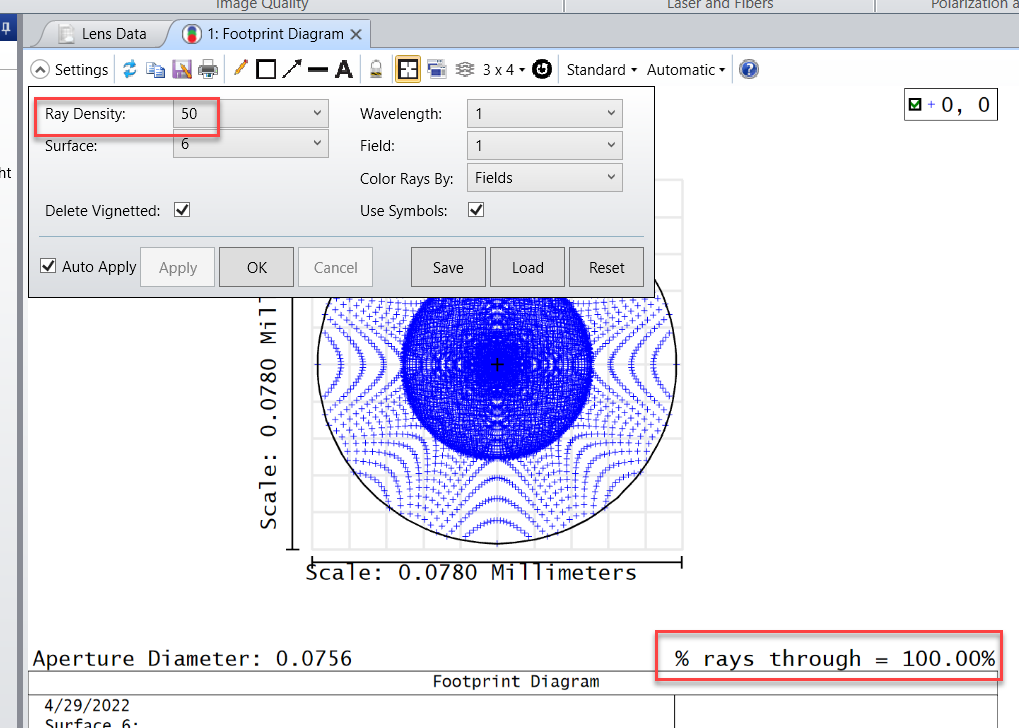
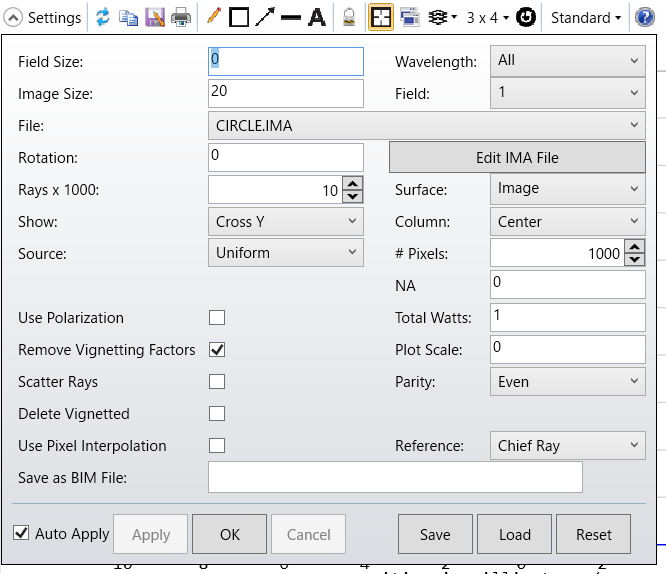
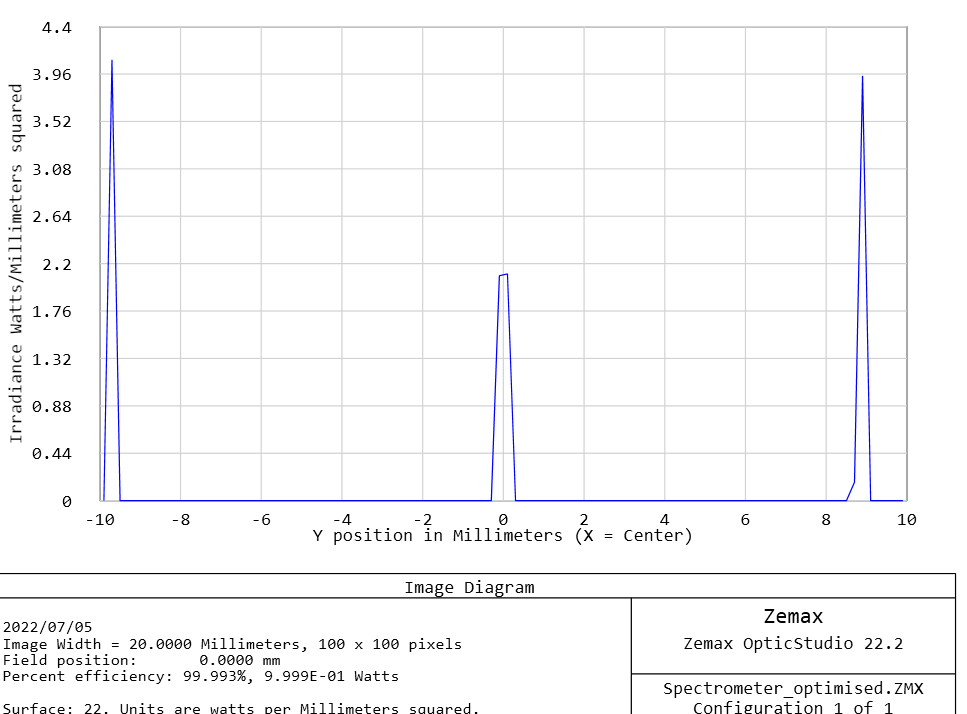
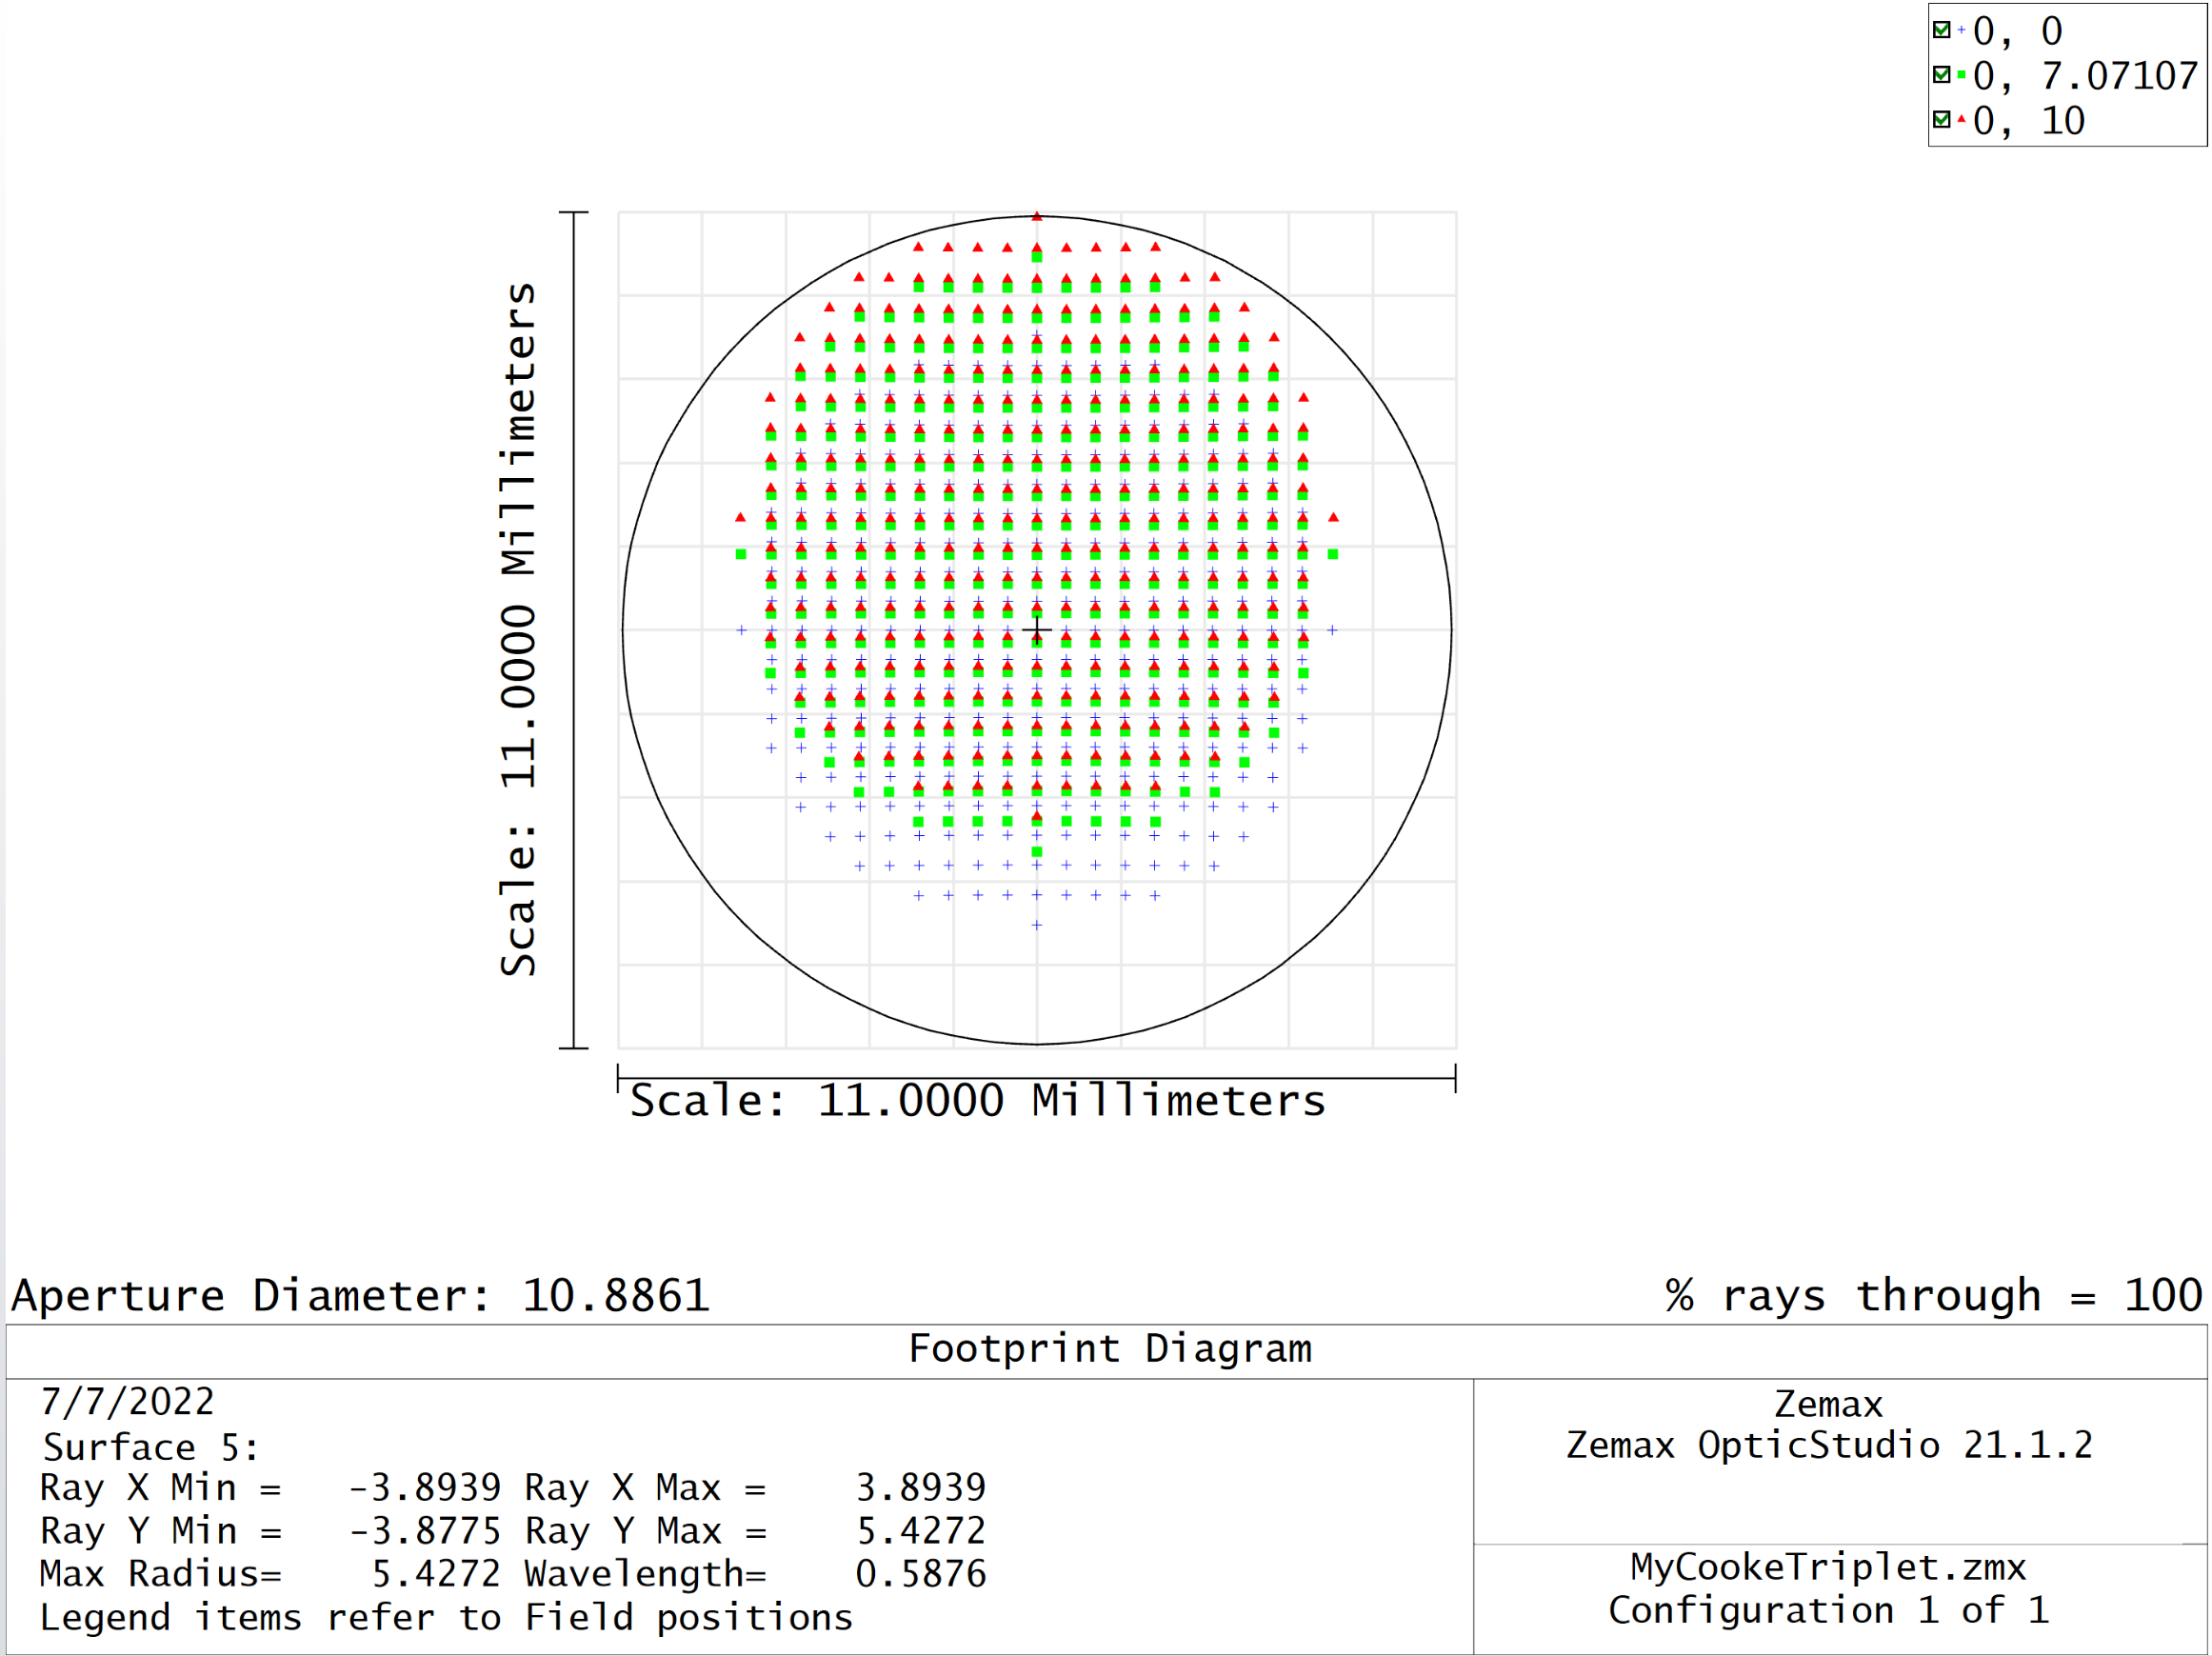
To evaluate system throughput, there are 4 tools you can consider in OpticStudio Sequential mode, Footprint diagram, Vignetting Diagram, Geometric Image Analysis (GIA), and Transmission analysis. The Footprint Diagram and Vignetting Diagram deal with vignetting only and does not consider the Fresnel reflection or bulk absorption losses. They show what fraction of the launched rays are being blocked off/vignetted due to surface apertures. The GIA can do the same thing, but it can also consider Fresnel reflection and bulk absorption losses if you check the Use Polarization button. And the Transmission analysis always includes Fresnel reflection loss and bulk absorption loss.

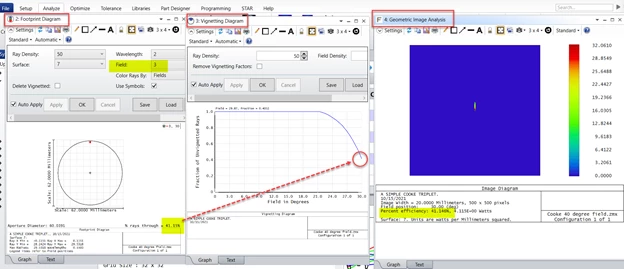
For example, in this system below, at the edge of the field 30deg, the Footprint diagram, the Vignetting Diagram, and the GIA (bottom reports “Percent efficiency %”, Use Polarization not checked) all report very similar system throughput.
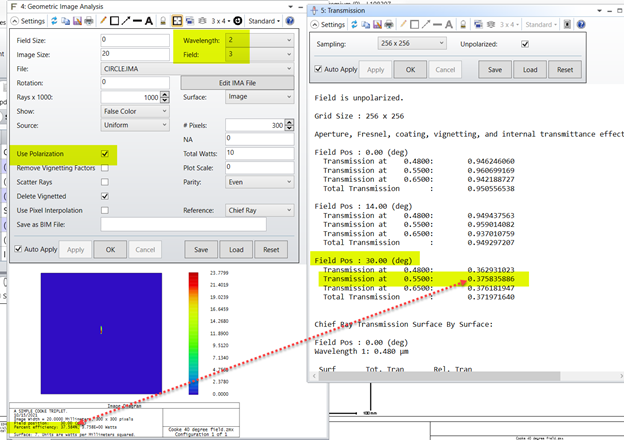
If you check Use Polarization in GIA, then it’ll consider the Fresnel reflection and bulk absorption losses. The Transmission always considers that loss. You can see in this case, considering Fresnel reflection and bulk absorption causes the throughput to drop from ~41% to 38% or so. And the GIA and the Transmission give very similar results.
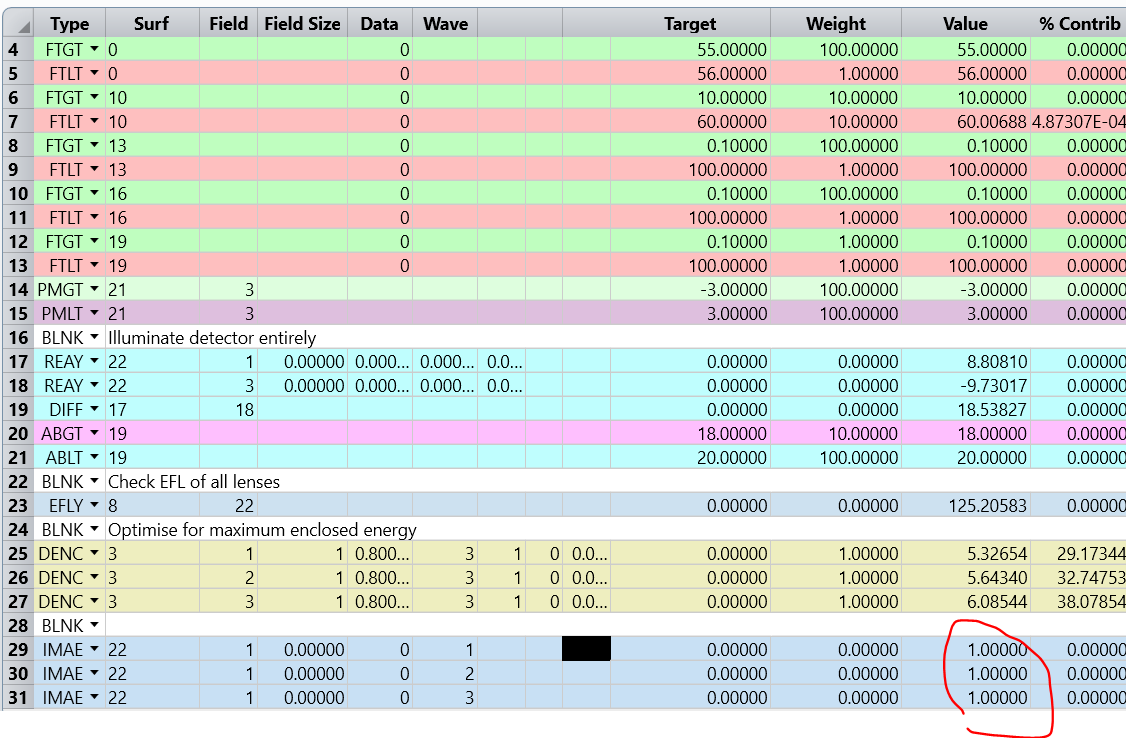
The above four analyses can be used to evaluate the throughput of your system (the fraction of the launched energy that can reach the image plane), considering different effects that lead to energy loss such as aperture vignetting rays, Fresnel reflection loss, bulk absorption loss, etc. The Enclosed energy on the other hand is only looking at what happens on a single surface. It looks at the “total” energy landing on that surface and what fraction of that energy is enclosed within certain radius. It does not deal with energy throughput of the system.


