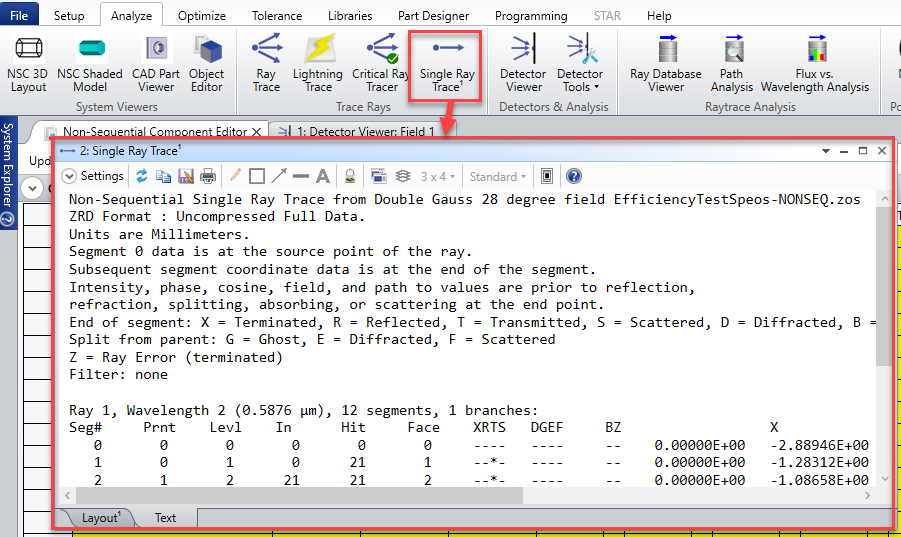
One of our goals in Ansys is to model reality so our customers get the most accurate modeling analysis that agrees with their measurements in the real world. As part of this goal, we are enhancing the Non-Sequential mode in OpticStudio. In the 22.3 release, the team brought to life the NSC single ray trace analysis; let me tell you, it is powerful and cool!

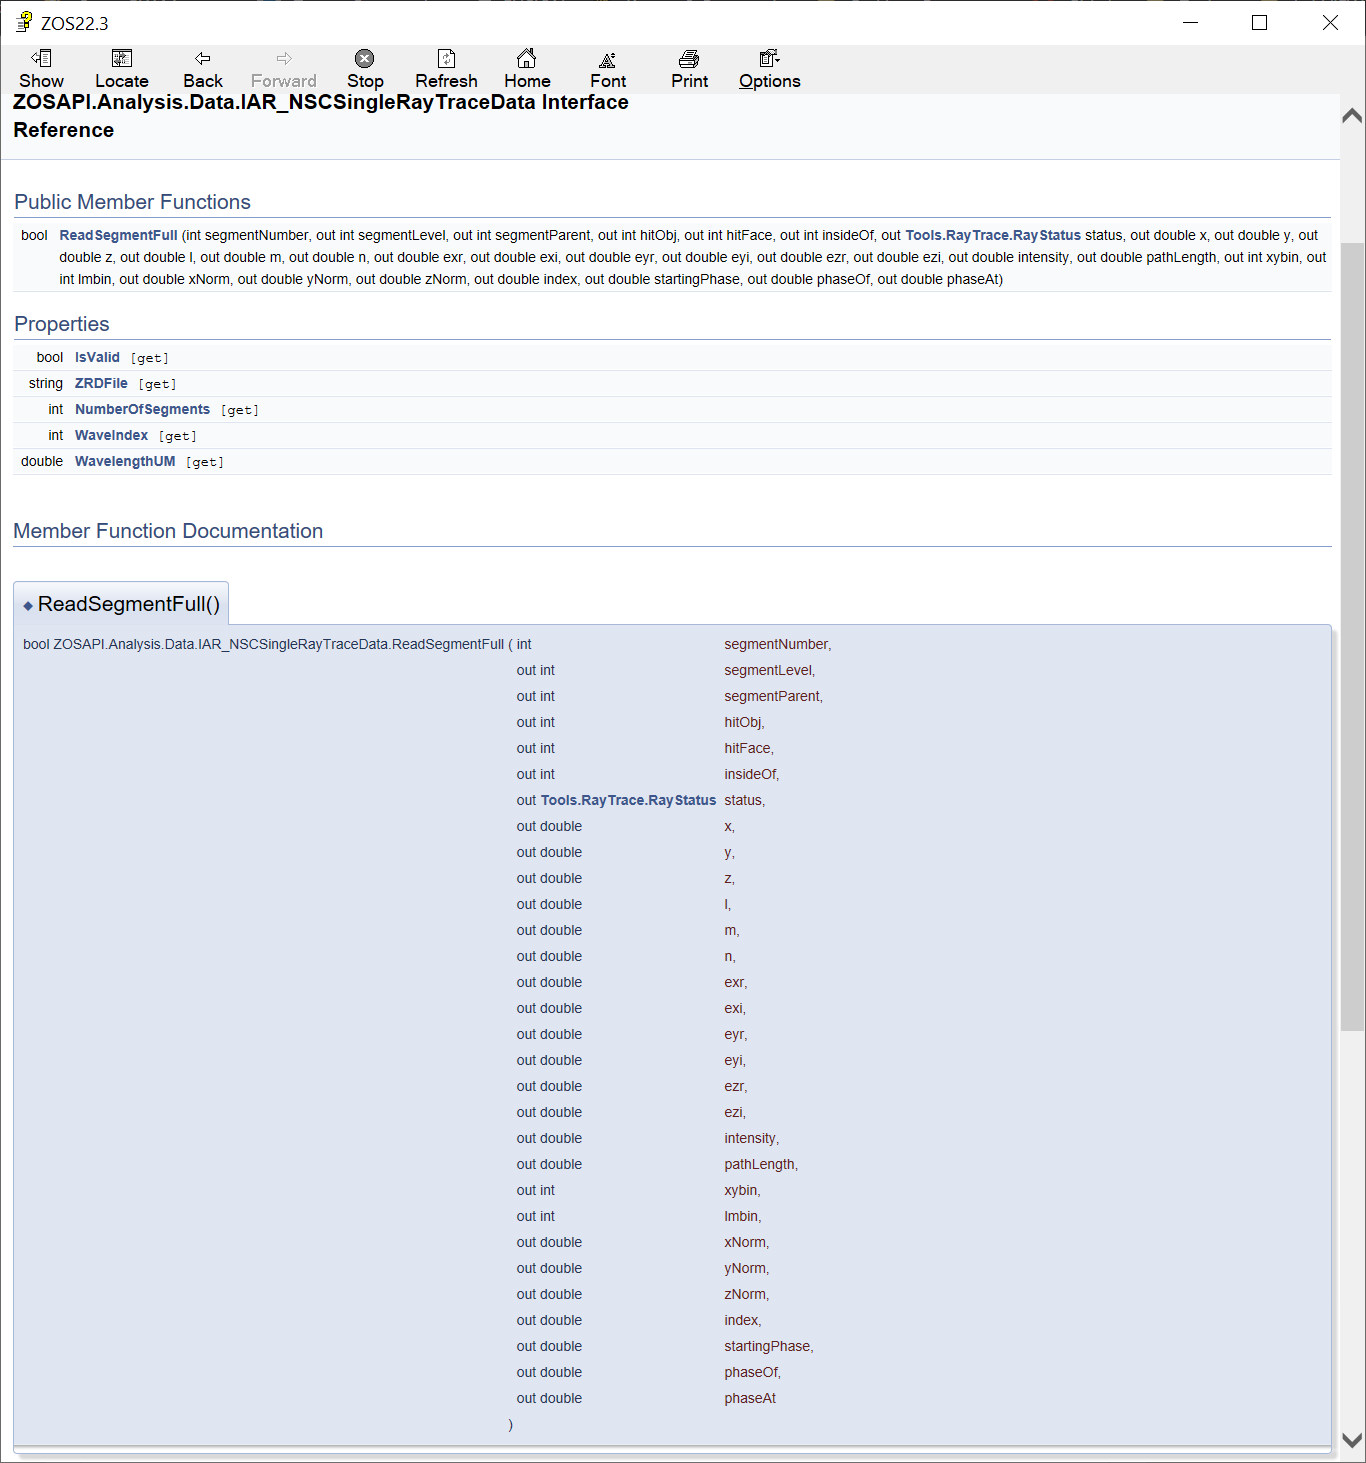
With the NSC single ray trace tool, you can add a source ray anywhere in the system space to evaluate light propagating. This tool will not modify or add an NSC object in the editor, allowing you to keep your editor system clean. Also, it provides all the ray data just as the ray database does. No more filtering ray databases to find the ray you want to evaluate! If that is not enough, the tool is also available in the ZOS-API and allows the extraction of any computed parameters. See attached example code for a basic introduction to this tool.
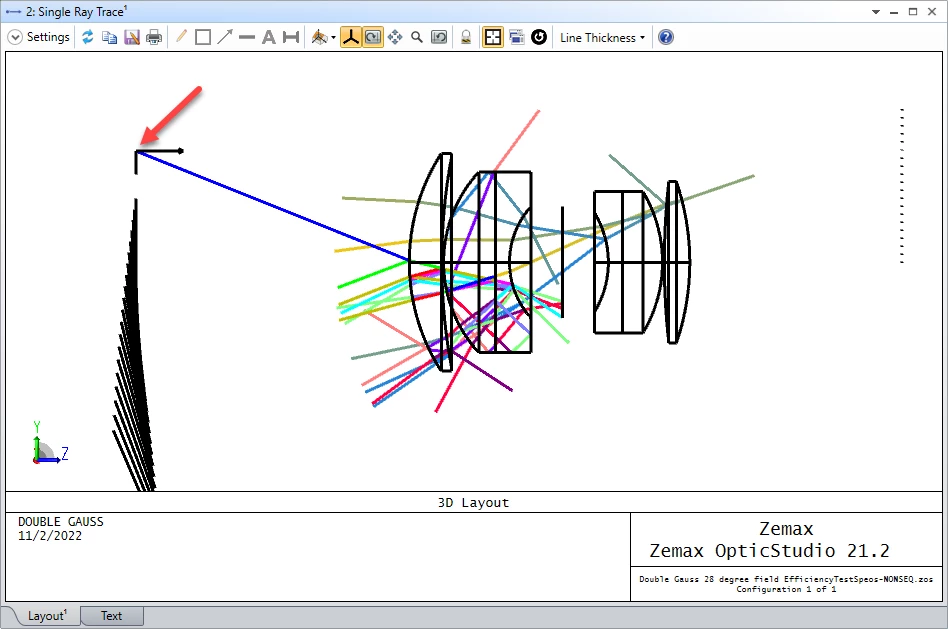
Also, look at the NSC single ray trace layout tab at the bottom of the analysis window. Here you can visualize the ray being traced to ensure it is the one you intend to analyze. The visualization becomes very powerful to our users when splitting and scattering are on since you can visualize the effects of stray light coming from that single ray. I look forward to seeing what our users will do with this tool.
 

Hey David,

Thanks for the update.  Did you forget to attach the sample code?  What I’m really looking for is if we have access to all 29 data points from the ReadNextSegmentFull which is covered by the IZRDReaderResults or if we’re still limited to the 13 data points for the SingleRayNormPolFull/SingleRayDirectPolFull from sequential mode? 

The developers would have had to add a new data structure to capture all 29 data points rather than reuse the old DDE code which the IRayTraceNSCData/IRayTraceNSCSourceData uses.  Right now, I cannot perform a full NSC ray trace in memory and get key data out like HitFaceIndex, or Nxyz normal vectors, meaning for custom NSC analysis I have to save a ZRD file and parse it, which is really slow.  

Hoping this addition has changed the underlying code so all the NSC ray tracing via the ZOS-API is better!


Hi @MichaelH ,


From just browsing the Help File, this feature is implemented as an analysis:

IA_  New_NSCSingleRayTrace()

It has specific settings, and the results seem to be given as an IAR_NSCSingleRayTraceData, which looks like it has the key data you are talking about (hitFace, index, xNorm, yNorm, zNorm) in its ReadSegmentFull function:

I haven’t tested it though.

Take care,


David


Thanks David, hopefully this means the rest of the NSC ray tracing via the API will be updated so calculations like NSC Sag Map, Angle of Incidence calculations or optical path length/wavefront analysis can be implemented in non-sequential mode without having to save a ZRD file.


Hi Michael,

The API for the single ray trace can access the same parameters as the ZRD without the ZRD database. I hope that suffices for your needs. If not, let me know and I can check what I can do. 

Also, I have attached the API .m example code. The system rejected the file and I did not noticed yesterday. Thanks for bringing that up :) 

David 


Hi Zemax community,

Thanks a lot for providing access to the single ray tracing capabilities via API.

I was wondering if it is possible to run a sequence of single ray tracing events.

I am interested in tracing rays from the location of my source through my system but with specific ray directions that I manually define in python.

When I try this in python, it seems that the single ray tracing tool is always tracing the ray with the same direction (on axis ray)


My code looks something like this:

nscsrt = TheSystem.Analyses.New_Analysis(ZOSAPI.Analysis.AnalysisIDM.NSCSingleRayTrace)
nscsrt_settings = nscsrt.GetSettings()
nscsrt_settings.RaySourceX = 0.0
nscsrt_settings.RaySourceY = 0.0
nscsrt_settings.RaySourceZ = 0.0
nscsrt_settings.RefObject = 2

nscsrt_settings.SplitNSCRays = False
nscsrt_settings.ScatterNSCRays = False
nscsrt_settings.UsePolarization = Falsea

for i in range(0,100,1):
nscsrt_settings.RaySourceL = I_diri0, i]
nscsrt_settings.RaySourceM = I_diri1, i]
nscsrt_settings.RaySourceN = I_diri2, i]


nscsrt.ApplyAndWaitForCompletion()
nscsrt_data = nscsrt.GetResults().NSCSingleRayTraceData


data_segment1 = nscsrt_data.ReadSegmentFull(1)
l_s1.append(data_segment1t10])
m_s1.append(data_segment1t11])
n_s1.append(data_segment1t12])

data_segment2 = nscsrt_data.ReadSegmentFull(2)
l_s2.append(data_segment2t10])
m_s2.append(data_segment2t11])
n_s2.append(data_segment2t12])

data_segment3 = nscsrt_data.ReadSegmentFull(3)
l_s3.append(data_segment3t10])
m_s3.append(data_segment3t11])
n_s3.append(data_segment3t12])

s1_dirs = np.stack((l_s1,m_s1,n_s1),axis=0)
s2_dirs = np.stack((l_s2,m_s2,n_s2),axis=0)
s3_dirs = np.stack((l_s3,m_s3,n_s3),axis=0)

In this case, I am interested in extracting the ray directions from 3 different segments in my system.

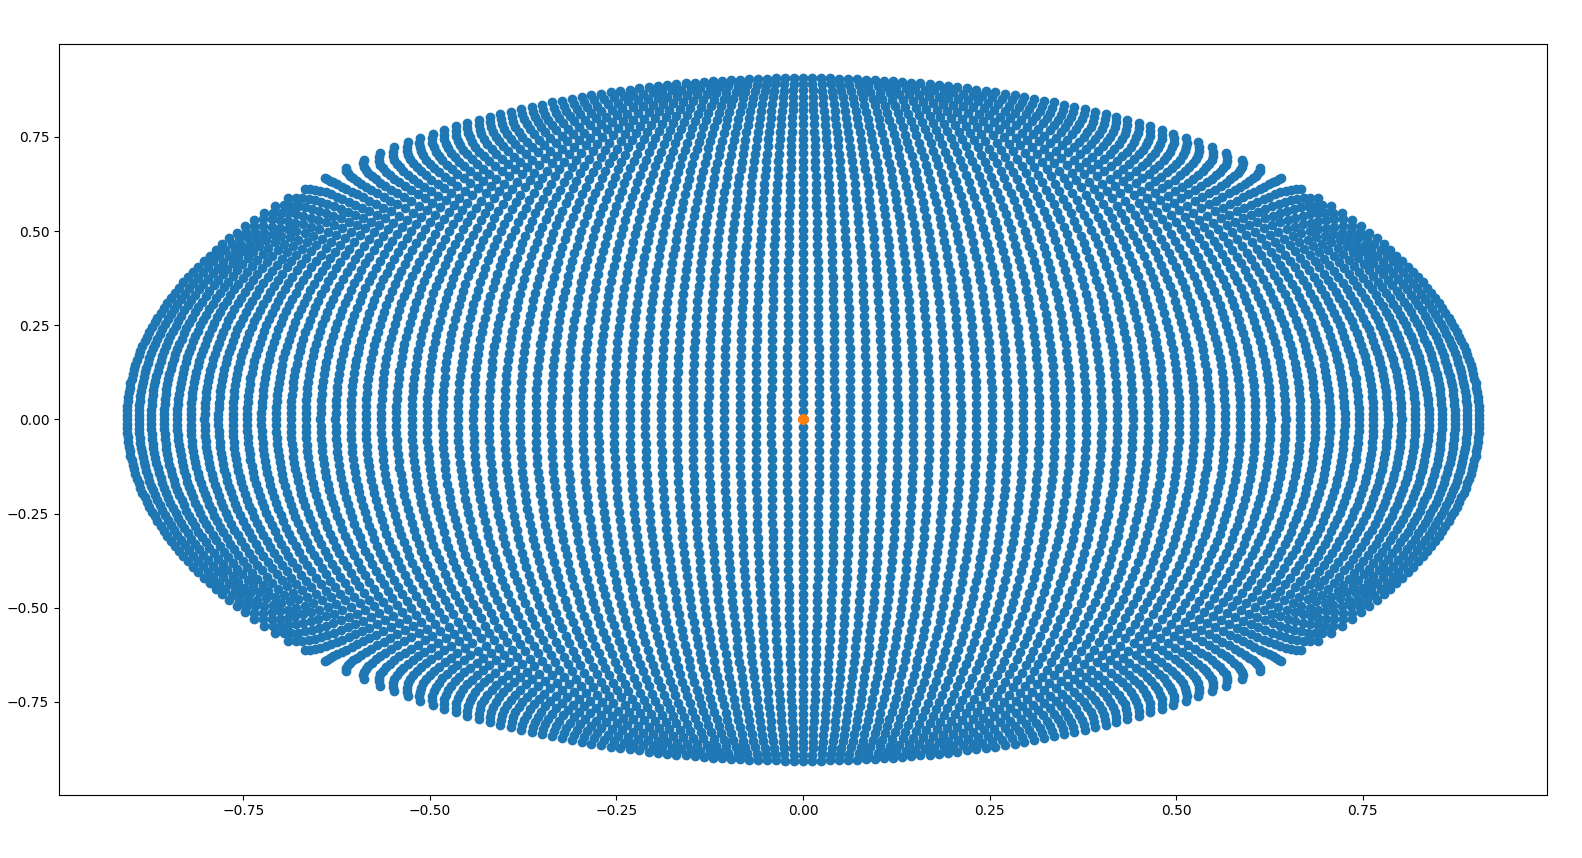
However, once I plot the results, I can observe that the single ray tracing tool is always tracing the same on axis ray. (The ray directions that I want to evaluate for are defined in the I_dir vector) You can see this in the following plot. Here I am plotting the x and y components of the direction vectors. The blue data corresponds to the ray directions I want to trace and the orange dot at the center is the result that I get from the single ray tracing analysis. As you would observe, I always obtain the on axis direction.

Any idea about what could be happening here? Can this be solved in any way?

Thanks for the help!


@CJ27 


It would be better if you could create a new topic for this question. When doing so, please consider sharing the relevant part of your code. For example, we do not know how you setup I_dir. There’s also a typo in this line:

nscsrt_settings.UsePolarization = Falsea

Also, can you clarify why you want to use a single ray trace analysis if you are going to trace multiple rays? It might make more sense to perform a batch ray trace.

If you create a new topic, I’ll have a look at it in more detail.

Take care,


David


Hi @David.Nguyen ,

Alright, got it. 

I will create a new topic. Thanks for the feedback!


Hey David,

Thanks for this posting. Can I just make sure I understand what the tool is doing?

Without adding a new source object to the editor, this feature lets you specify the x,y,x,l,m,n etc of a new ray and the feature then traces that ray through the system and gives its own layout and text report, yes?

Does it do anything you can’t do with a Source_Ray and just tracing that one Analysis ray? I’m not seeing what extra information the tool is giving you, other than not having to add the source to the editor... you’ll need to give the tool all the same data anyway. What is the extra that this tool is giving us?

  • Mark

Hi, Mark.  It really does only spare us having to add the source ray to the NSCE.  It’s pretty helpful for setting up ray-based optimizations in nonsequential.  In my pre-zemax life, all of us did this frequently; for example, you might add a gut ray to position optics for an off-axis system.  Adding additional rays can cause the editor to get out of hand pretty quickly, though of course, hiding the rows helps.


Reply