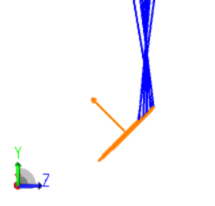
Hi,


I am in doubt how to understand y-real and also Cross-y in image analysis of the tilted system.

I have used a code to generate spectrometer resolution for the tilted detector like below:
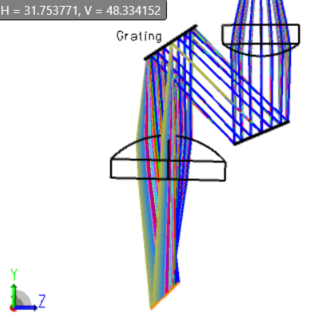
In the ZPL code I used “yf = RAYY(Last_surf)” for determining my y position. However I am not sure I understand if RAYY is the correct one to use to show the position of the beam on the image plane and calculate the resolution or I need to multiply that by the cos(angle).

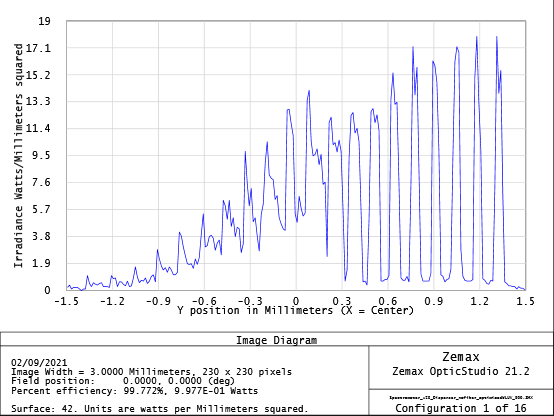
Also, I am trying to use the geometrical image analysis for looking at the beams in different wavelength to see how resolvable they are by choosing 5nm resolution and how wide the beams are. I would like to know if that is the way to go. In this case I also used Cross y and I am in doubt what is the coordinate and if this is along the image plane. 
 

Thank you in advance,

Fatemeh

You look to be on the right track, Fatimeh

When designing spectrometers, make sure you have checked ‘Ignore Lateral Color’ in the Optimization Wizard. In a spectrometer, lateral color is precisely what you want to achieve, and is not an aberration.

The REA* operands will give you ray data measured in local coordinates on the surface in question. GLC* will give you the same data in global coordinates. It’s always a good idea to select the option ‘show local axis’ in the Draw tab of the surface’s Property Inspector so you’re sure where the local axes are.

  • Mark


Hi Mark,

Thank you for your helpful answer.

When I press on “draw local axis” it is indeed very useful, but it is showing the norm I assume.

Is there a way to make it draw all three axis in local coordinate?

      Fatemeh


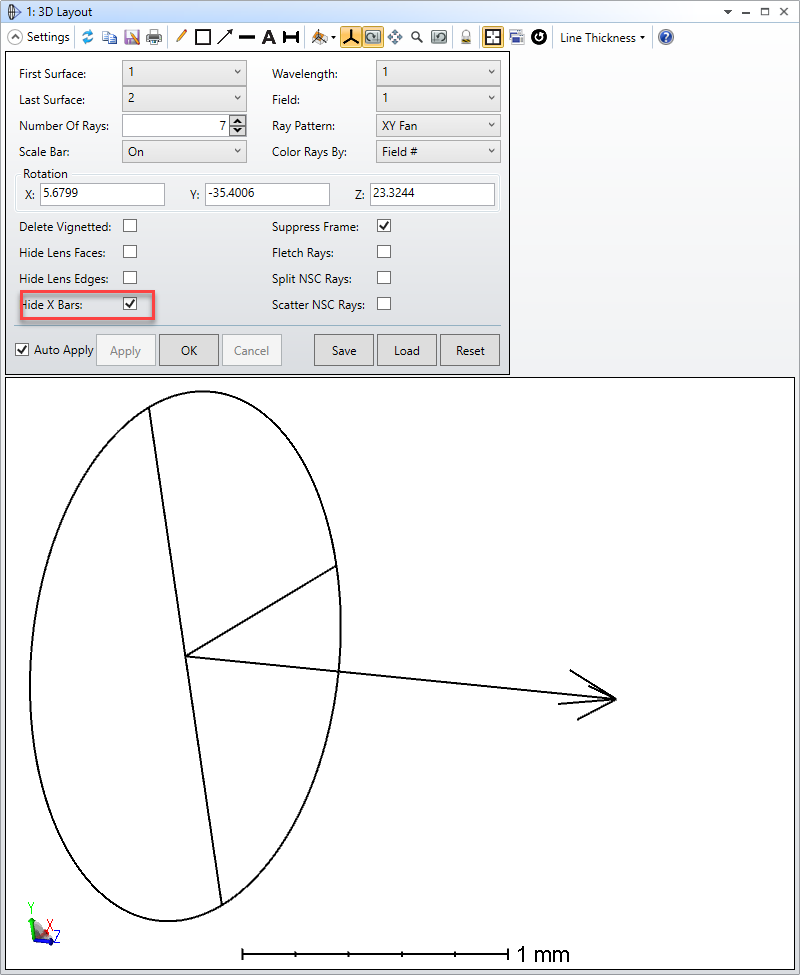
It’s showing the local z axis. The X and Y axes are there, but they may be obscured by the surface detail. OpticStudio will usually draw the surface detail along the local x and y axes.Here’s a flat surface, with the X-bars hidden:

The y-axis is along the vertical line that OS uses to draw the surface.


Thank you Mark. Clear.


Reply