XY scan

  • 9 April 2021
  • 5 replies
  • 206 views

Hello,


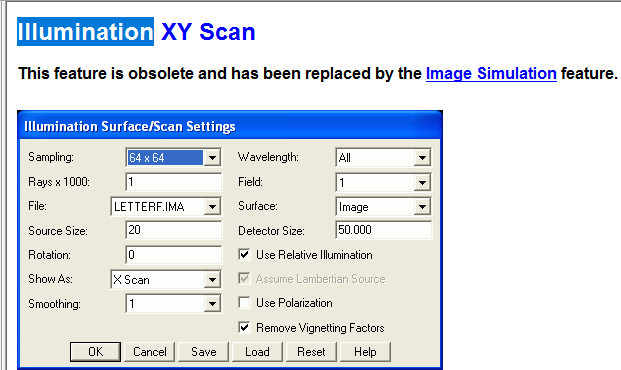
in old versions of Zemax there was the tool 'illumination XY scan' under 'Extended Sources Analysis' in sequential ray tracing.


Where can I find this tool in current version?


Thanks


5 replies

Userlevel 6
Badge +2

Hello Mamoun


From what I can see, it is no longer available and was replaced by the Image Simulation:


Can the Image Simulation do what you are looking for?


Sandrine

Hello Sandrine,


Thank you for your quick response.


I want to analyze the image of a 'slit source' in either X or Y. This was easily achieved with Scan XY.


Unfortunately, the new 'image simulation' does not allow us to see a cross-section in one direction or to save the results in a text file (see screenshot).


However, the cross-section is possible with the 'geometric image analysis', but it does not take diffraction into account.


Userlevel 6
Badge +2

Hi Mamoun


I did a little more research about the “Illumination XY Scan” function and this feature been removed since OpticStudio 14. The “Image Simulation” function can be used instead but as you were saying, it doesn't give direct cross-section illuminance data for the image plane. Instead it produces a photo-realistic representation of the output image for imaging systems.


One way to plot the cross section is to save the image:


Then and sorry because this is not straight-forward you can use this free tool called https://imagej.nih.gov/ij/. This tool allows to measure a profile of an image. So for example here:


I will report these limitations to our product team. I know we have in mind to have such an equivalent tool tool in OpticStudio.


Sandrine

Hello Sandrine,


I think your suggested method suits me perfectly.


Thanks for your efforts.


Mamoun

Badge

Adding some ImageJ details to this older post. May be useful to someone else unfamiliar with ImageJ.

Like the OP, I want to analyse the cross-section of an image of a slit source with diffraction.

Having opened the saved bmp in ImageJ, first I separated the colour channels Image… Color… Split Channels. Tuned out not to be necessary, but rendered the image in greyscale that I’m used to seeing.

With the Straight line tool from the toolbar, draw a line through the image. Holding Shift while doing this restricts the line to horizontal or vertical.

To get the cross-section- Analyze… Plot Profile. There is a Live button at the bottom of the plot window that gives a live cross-section as you move or change the length of the line.

The cross-section initially didn’t look correct to the pixel values I could see in the image. It became clear when changing the line length that there is some interpolation being applied. To turn this off, at the bottom of the plot window, select More»… Plot Defaults… and uncheck the Interpolate button.

Next, I can ‘bin’ along the slit image by setting the line width. Double-click on the Straight line tool in the main toolbar to bring up the Line Width slider and adjust as required.

Finally, I can select Data»… Add Fit… to fit, e.g. a Gaussian curve to the cross-section

It would be great to see tools like this implemented within OpticStudio.

James

Reply