Solved

Why the RMS spot radius is different from the Spot diagram VS Merit function RSRE ?

  • 30 April 2021
  • 3 replies
  • 2494 views

I am trying to find the best way to compare results for my system tolerances and I would like to find a good estimation of my focused spot size and coordinates changes.


I would like to understand why there is a difference between the RSRE merit function value and the spot diagram value of the RMS spot radius if I am using the following :


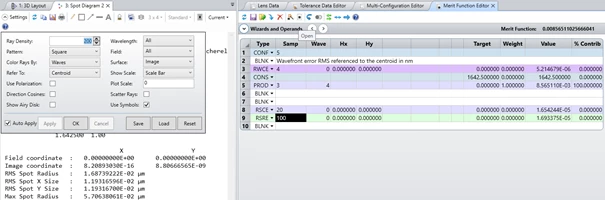
Spot diagram : use 200 rays along the width and height in the spot diagram (rectangular pattern).


RSRE : have 100 rays for 1 pupil quadrant which means 200 rays along the pupil width (rectangular pattern).


The RMS spot radius is :


Spot diagram


RSRE


1.68739222E-02 um


1.693374956387612E-005 mm = 1.693e-2 um


Thank you for your help

icon

Best answer by Sahil 30 April 2021, 18:33

View original

3 replies

Userlevel 4
Badge +1

Thanks for posting in Zemax forum!


The reason behind both radius is different. I have mentioned in table


Difference between RSRE and RMS spot Diagram
RSRE                RMS Spot Diagram

This operand considers vignetting. In the calculation of spot Radius  its uses Vignetted rays,which ultimately leads to increase the spot radius.


As we know vignetting occurs at the corner. The radius includes the vignetted rays which increase the size of  


OpticStudio does not plot vignetted rays on spot diagrams, nor are they used in computing the RMS or GEO spot radii.


So that's why we have RMS Spot Radius smaller


In case if you find difficluty feel free to post again.


Regards


Sahil Rajan


Userlevel 7
Badge +3

Sahil is correct, and there is another reason also. RSRE predicts what the spot will be on the basis of a full pupil of rays, whereas the spot diagram uses whatever rays you have defined in the Settings. As you increase the sampling in the spot diagram, the RMS spot computed there will converge to the RSRE result. In other words, the RSRE result is the correct answer, and the Spot Diagram suffers sampling issues relative to it.

Thanks for your answers, now I understand that I can trust the RSRE results and go further in my tolerancing script.


Regards

Reply