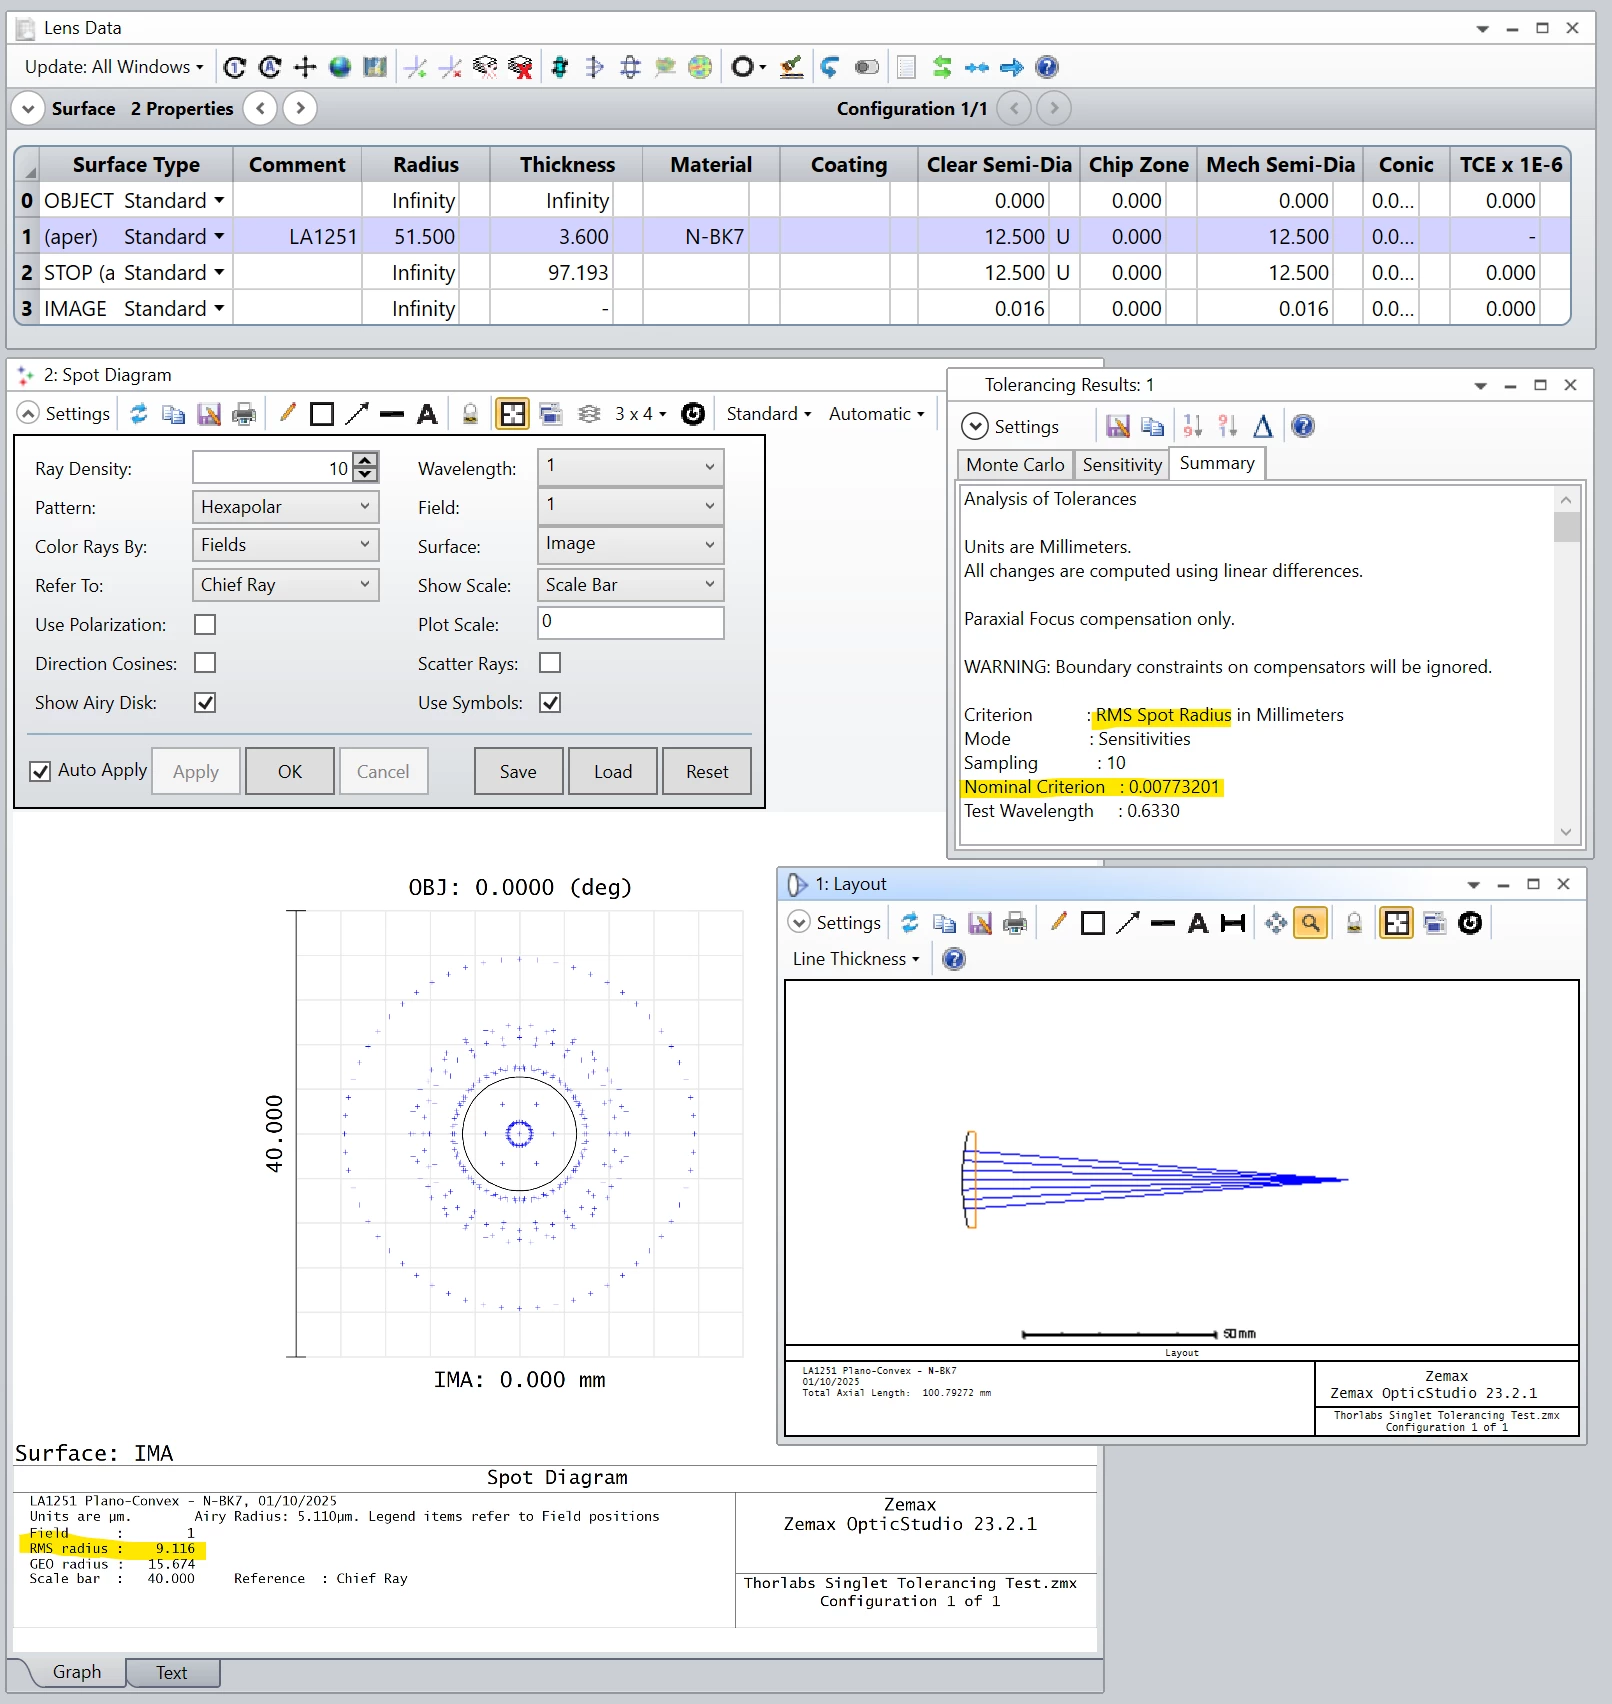
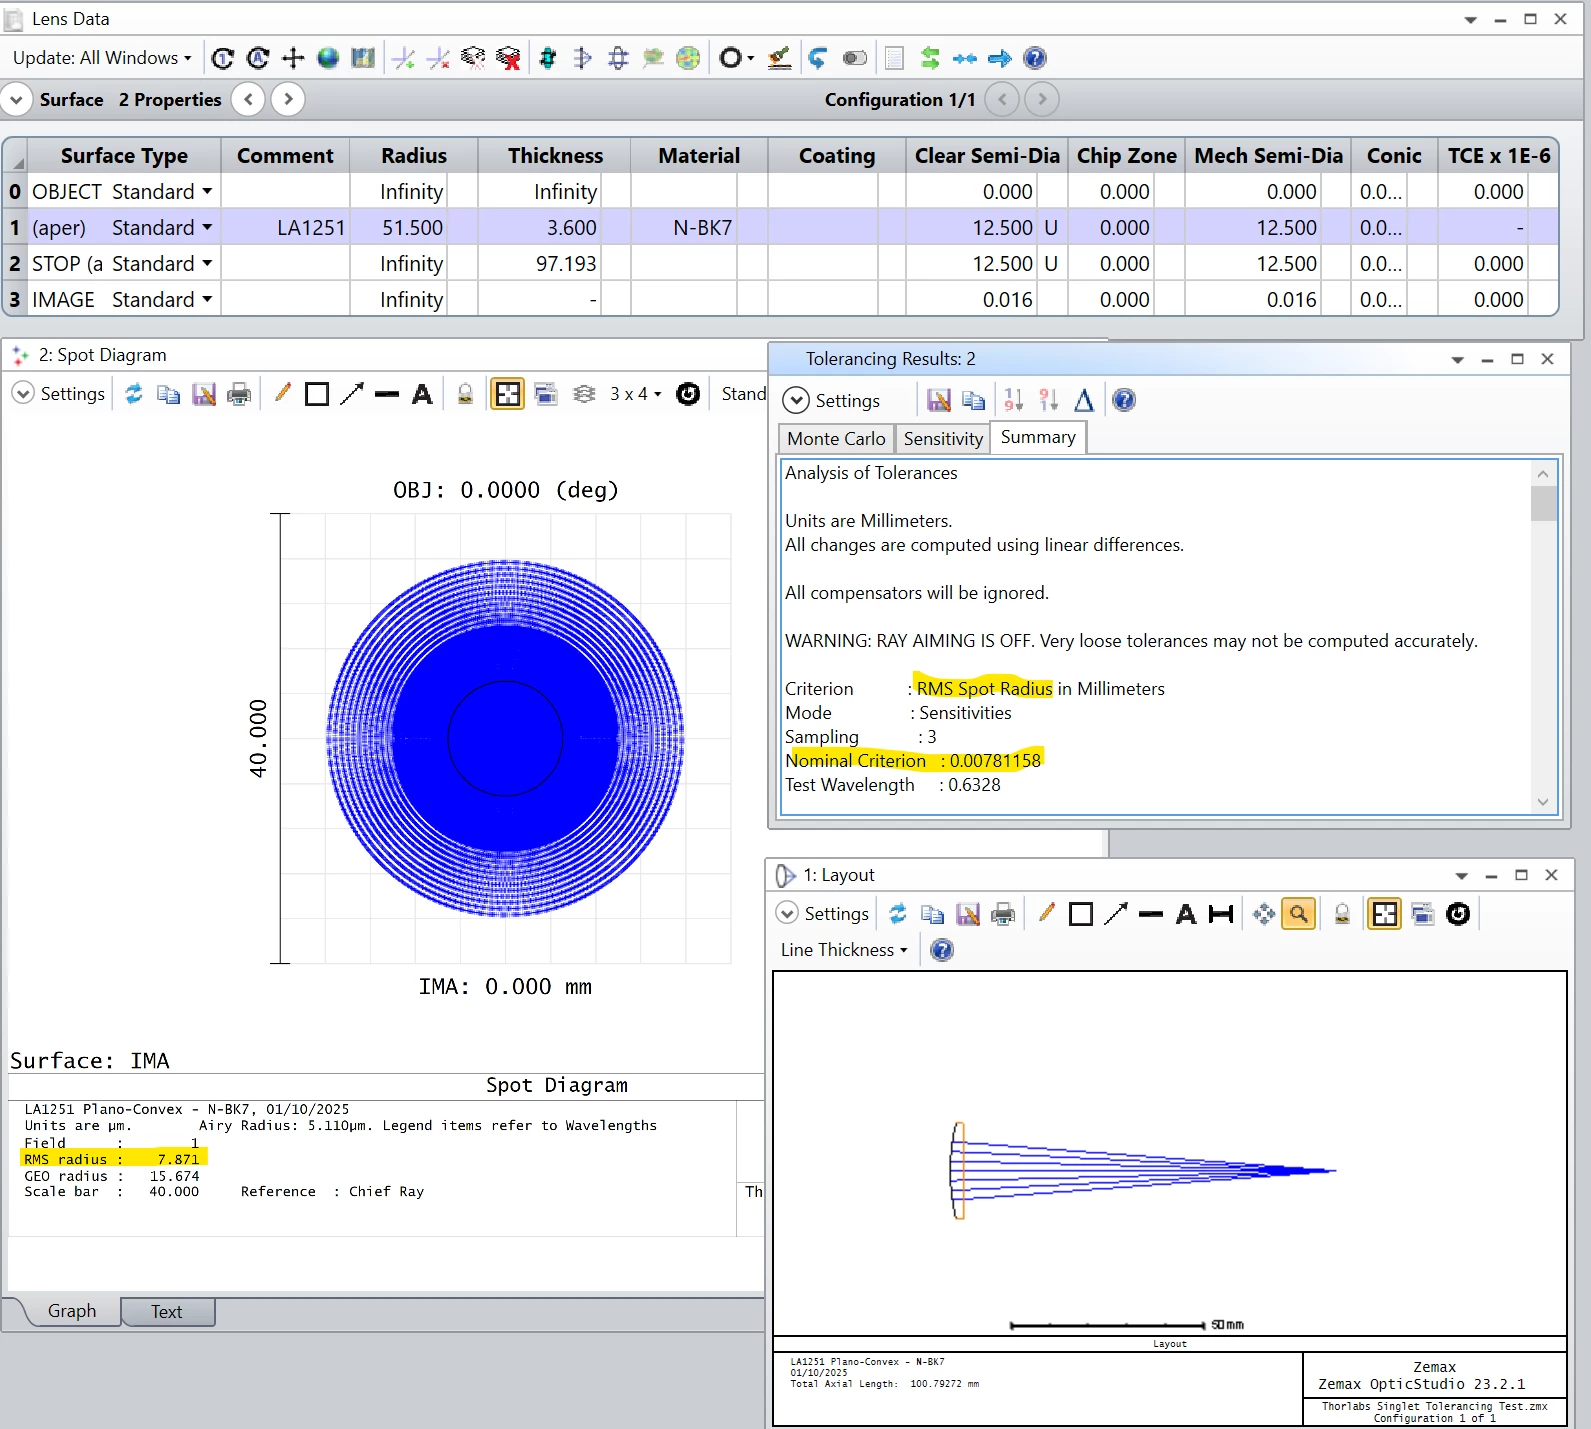
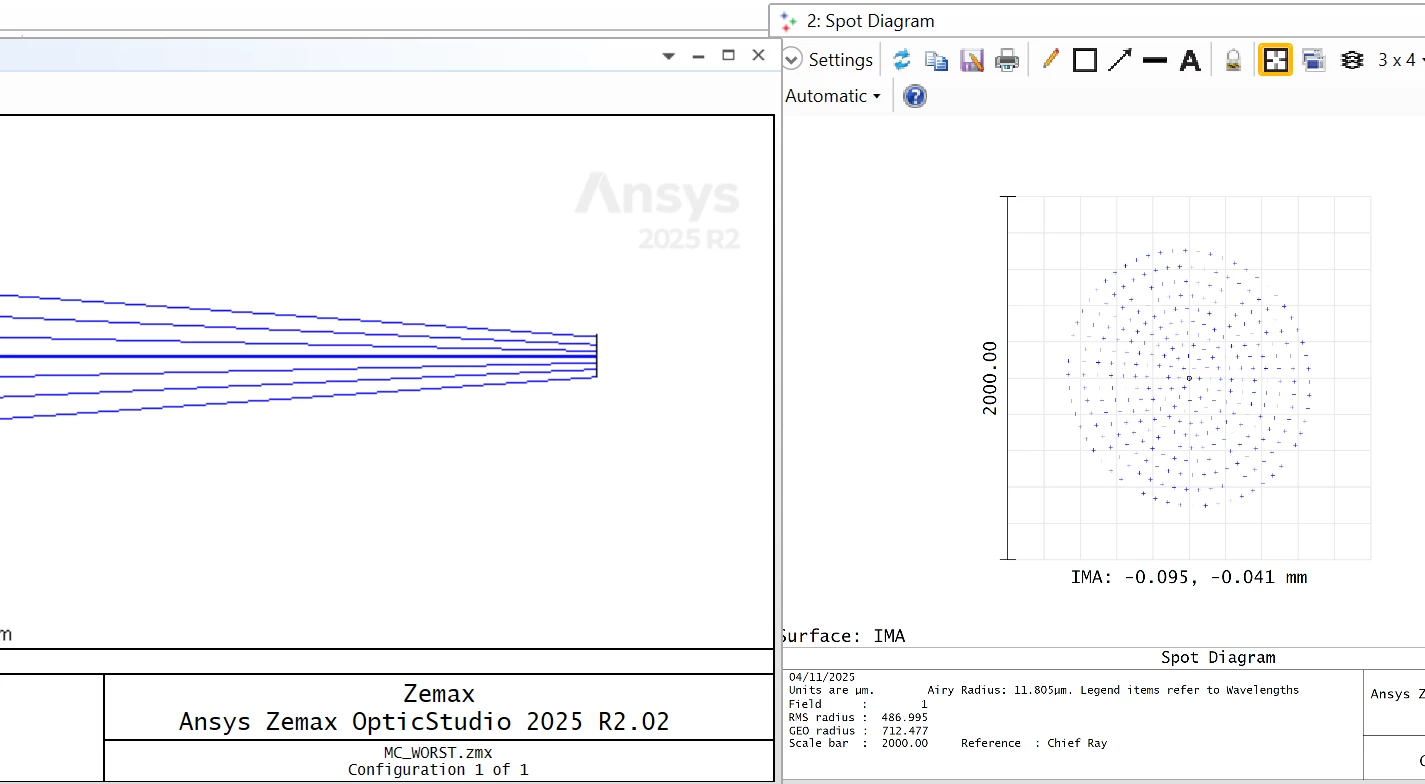
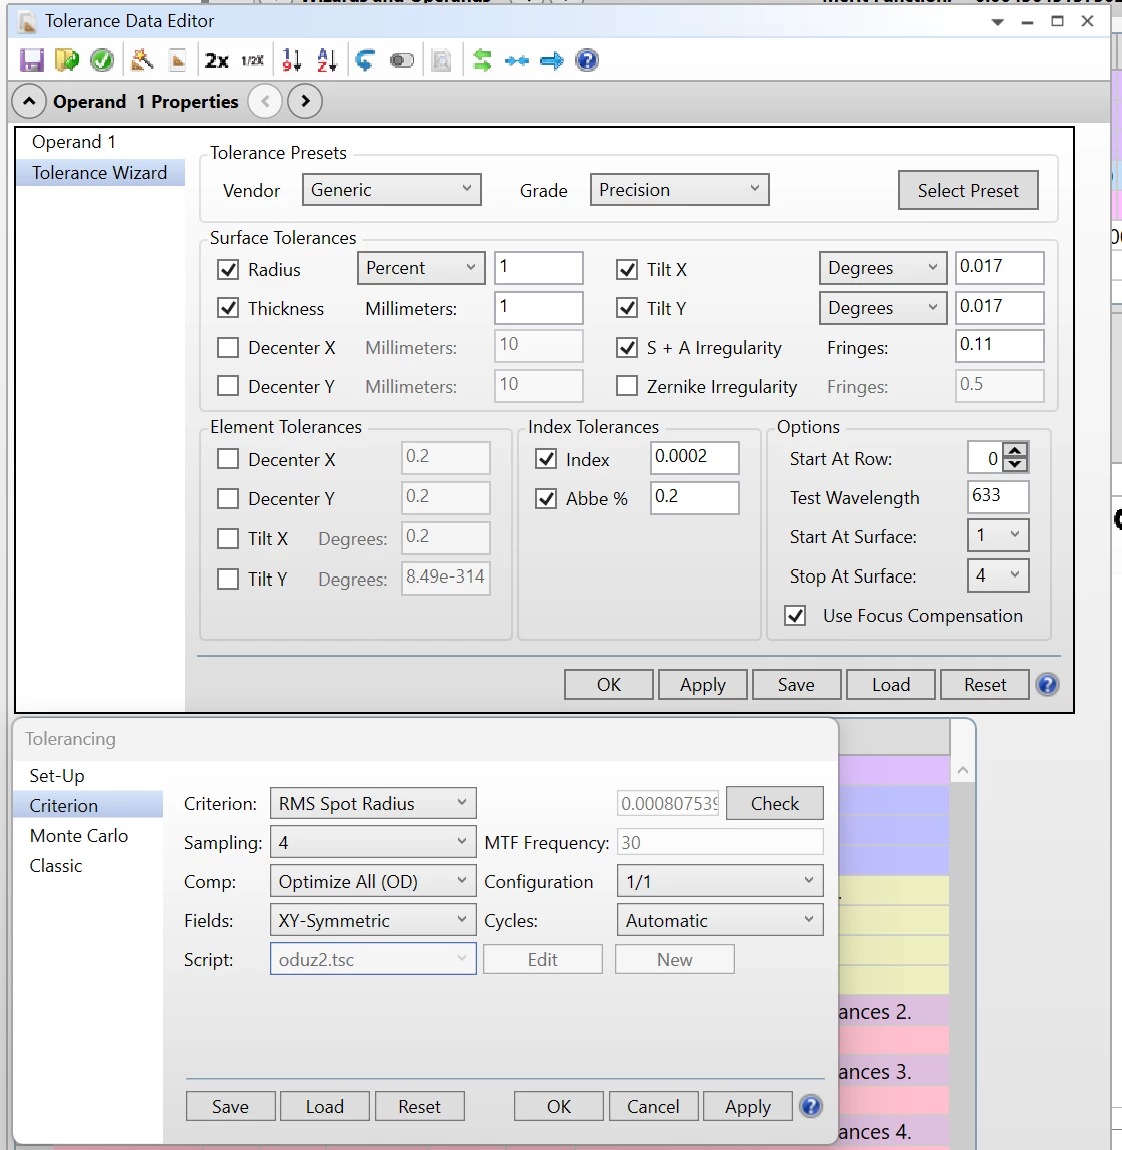
Hi, I’m trying to learn how to use tolerancing tools in zemax. For this, I uploaded a singlet file from thorlabs catalog, to start with something simple. No merit function or variables in this file. I do not understand why the RMS spot value is not the same in the tolerancing summary and in the spot diagram.
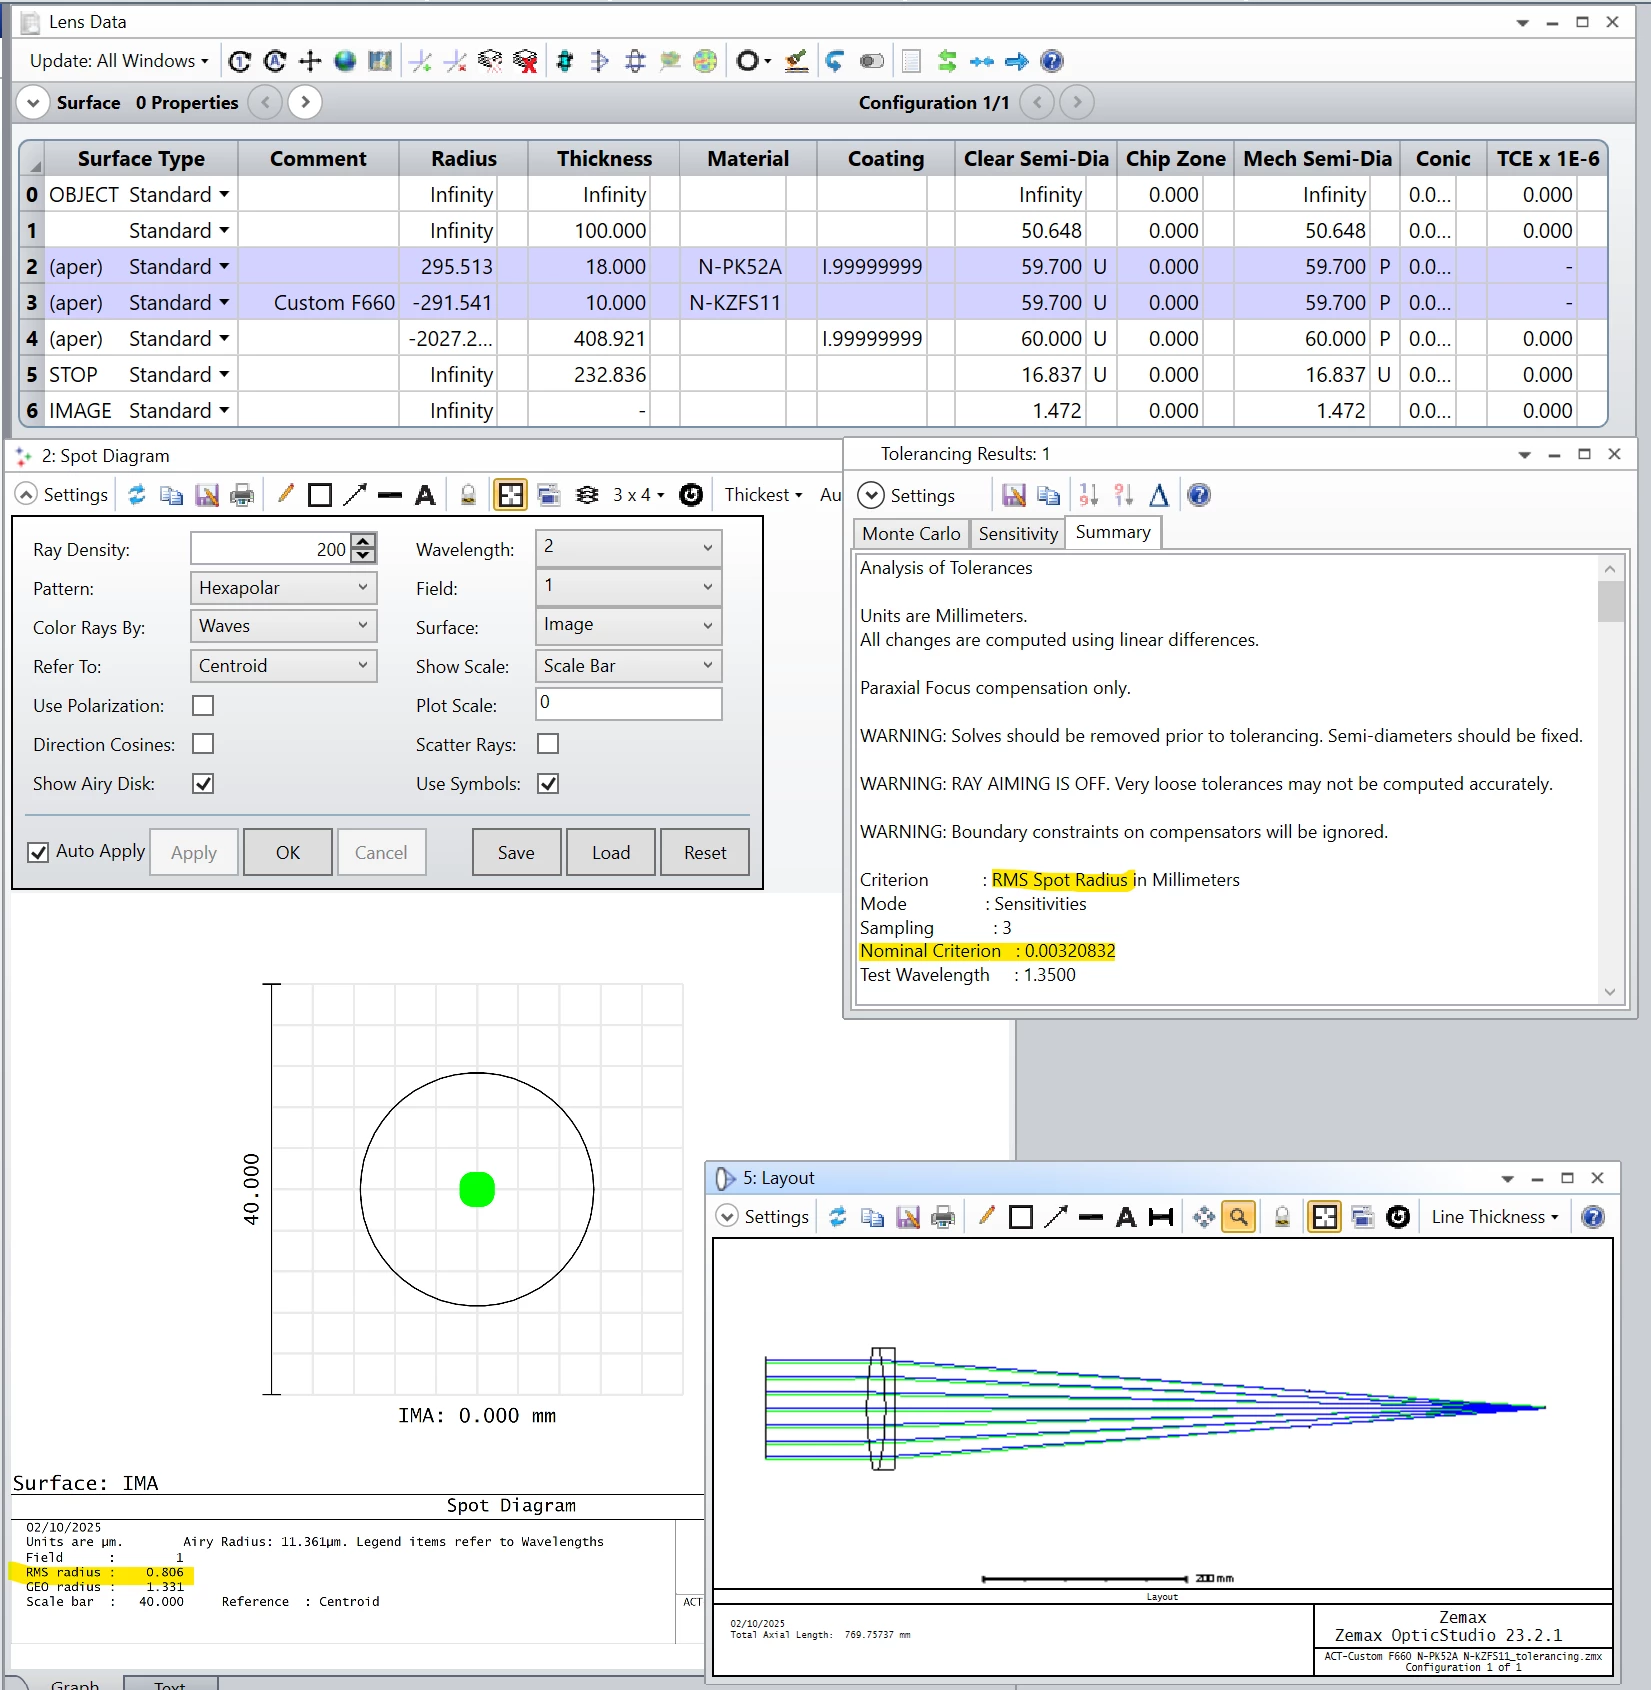
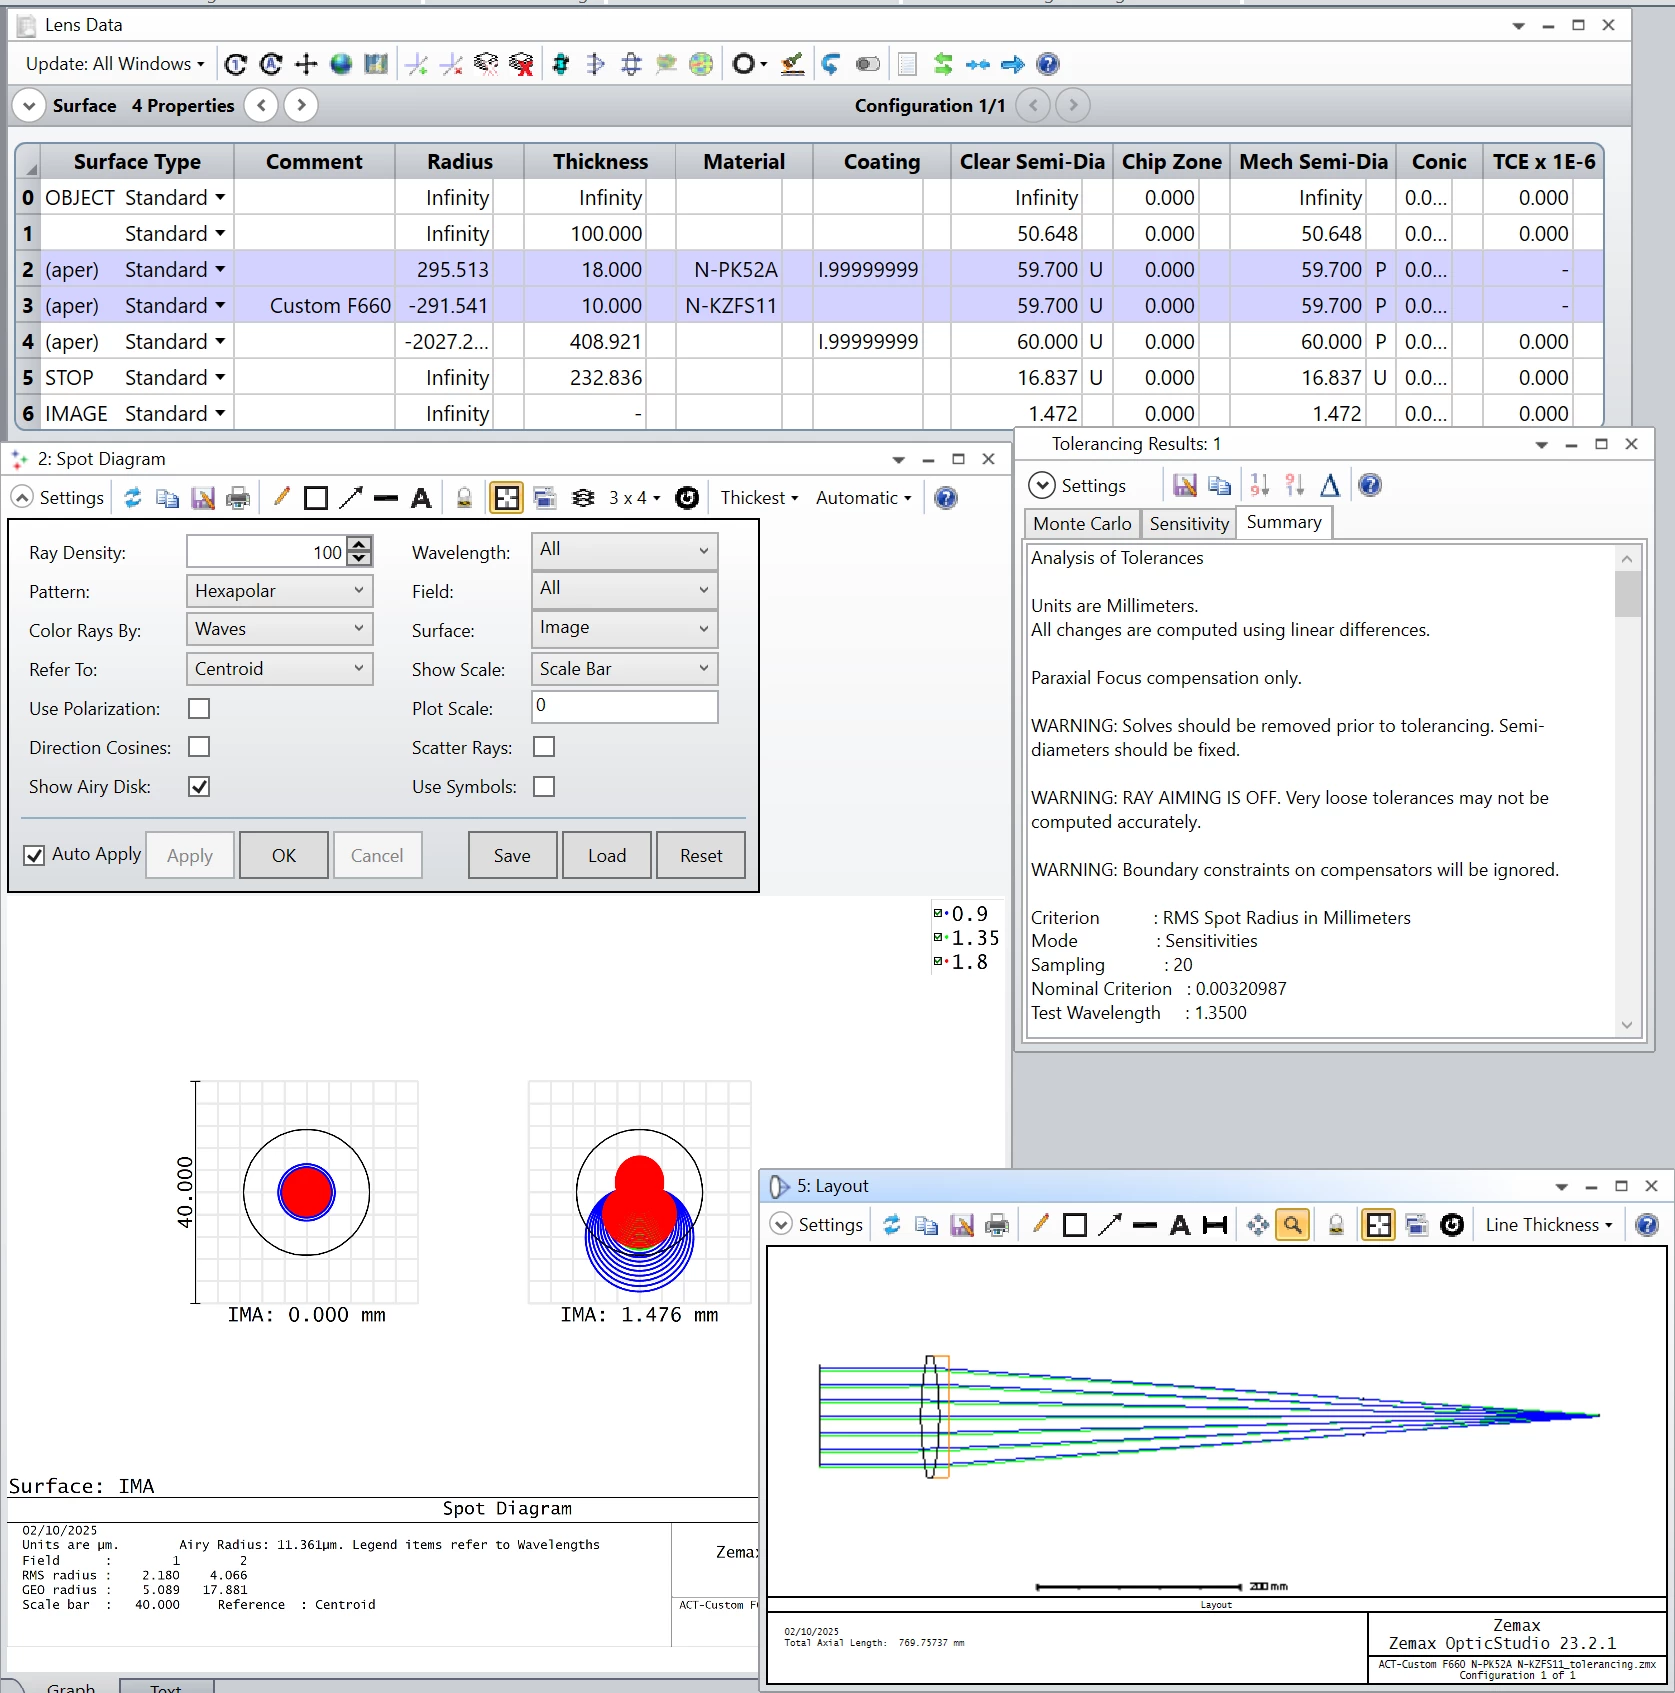
I tried different sampling but it didn’t help. Here the values are close (7.7 and 9.1 microns), but with more complex files the difference was really large.
See capture: