Tolerancing nominal criterion value differs from spot diagram
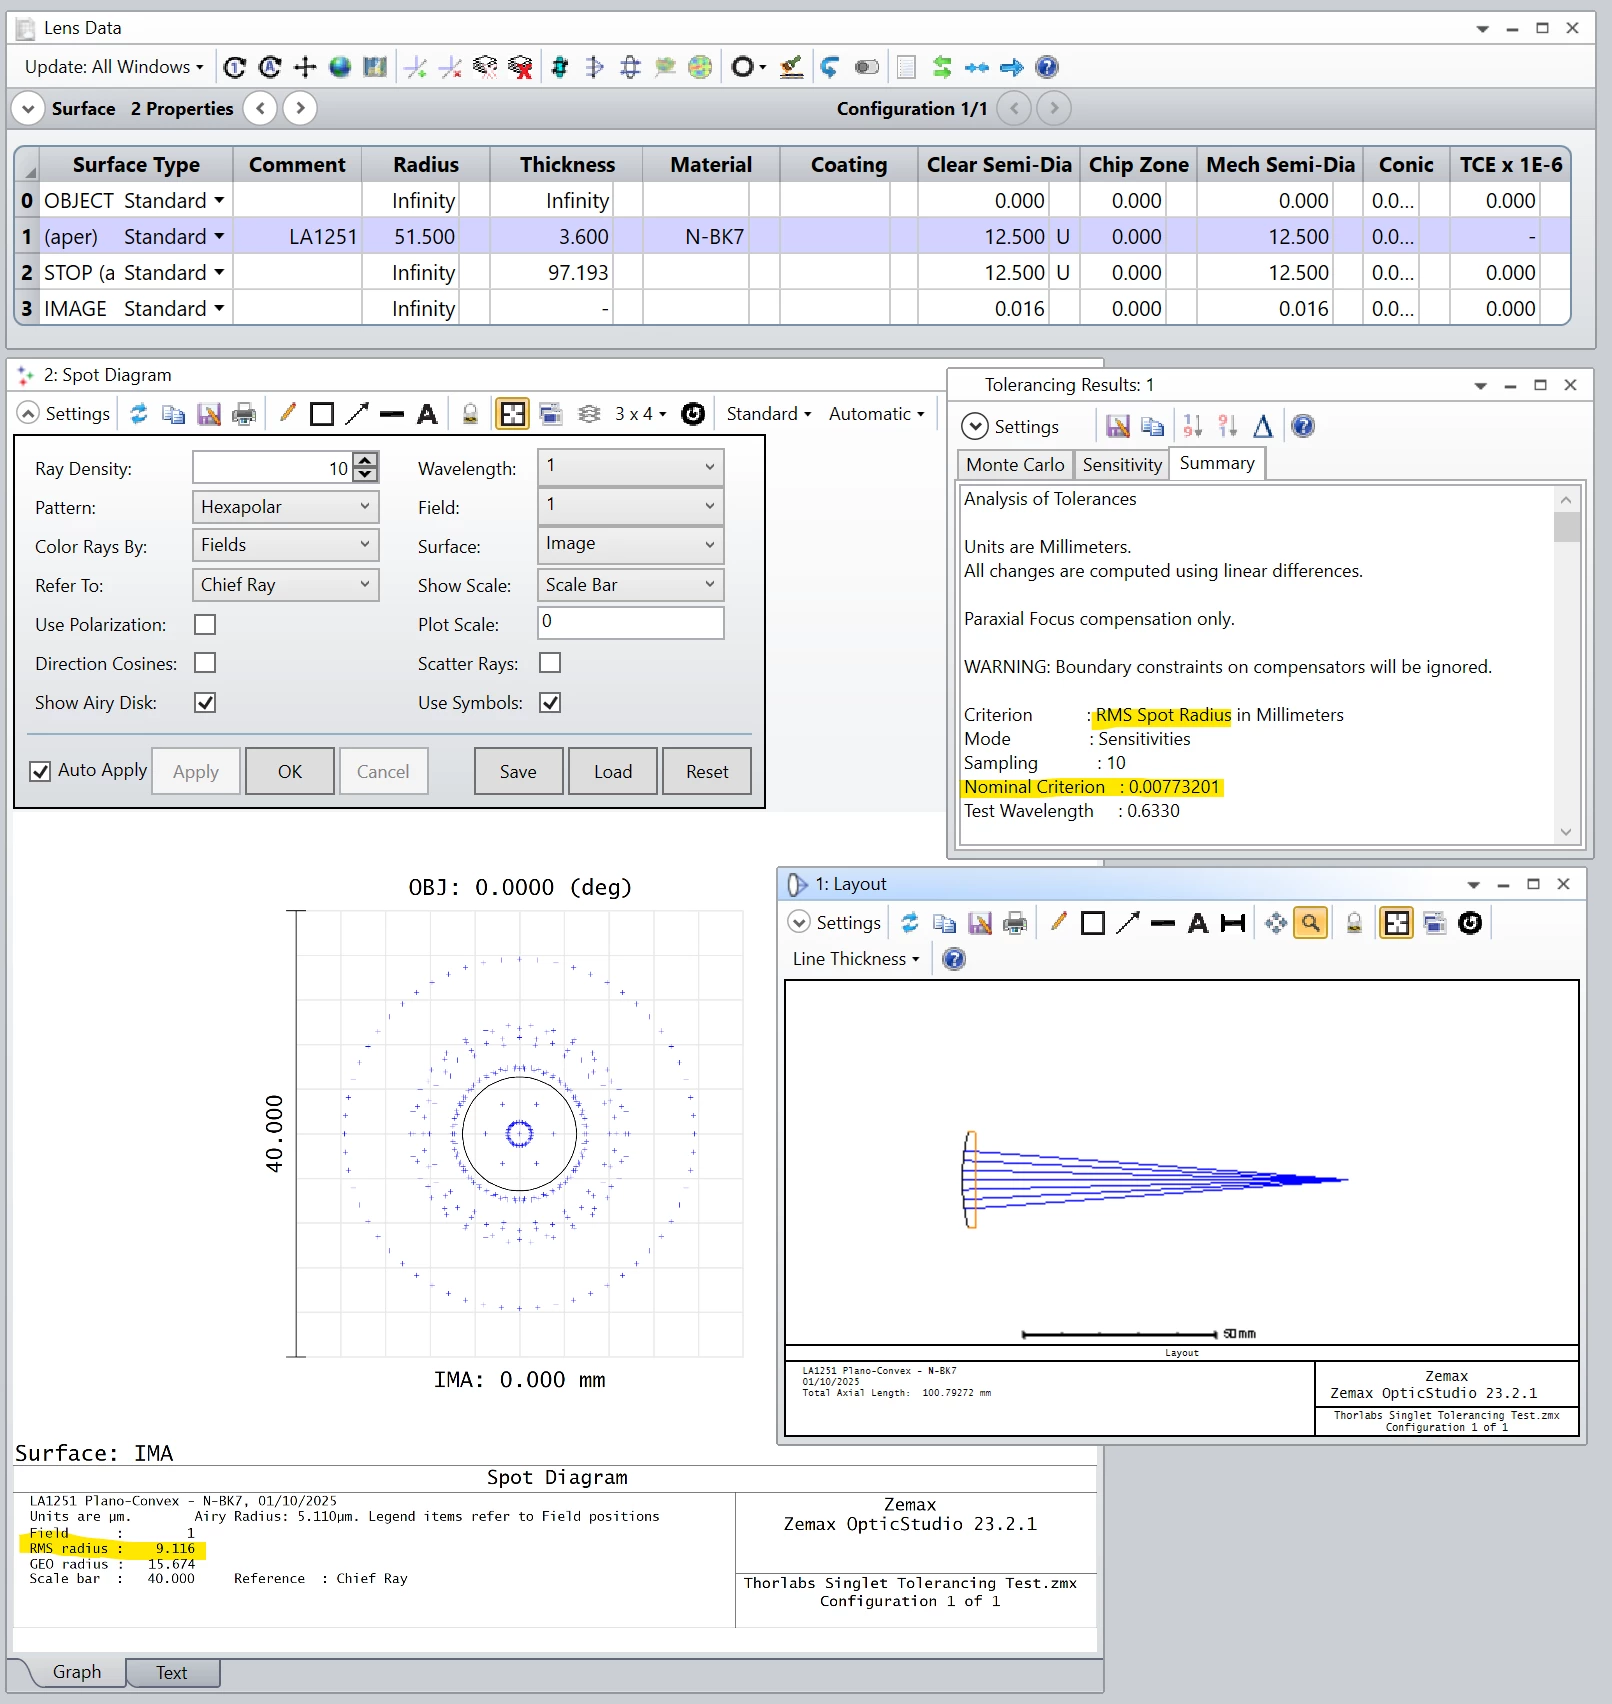
Hi, I’m trying to learn how to use tolerancing tools in zemax. For this, I uploaded a singlet file from thorlabs catalog, to start with something simple. No merit function or variables in this file. I do not understand why the RMS spot value is not the same in the tolerancing summary and in the spot diagram.
I tried different sampling but it didn’t help. Here the values are close (7.7 and 9.1 microns), but with more complex files the difference was really large.
See capture:
Page 1 / 1
Hello, as far as I know, nominal criterion set as RMS spot radius in the tolerancer refer to the spot radius in the RMS vs. Field tool in the Analyze tab. Spot diagram is more accurate.
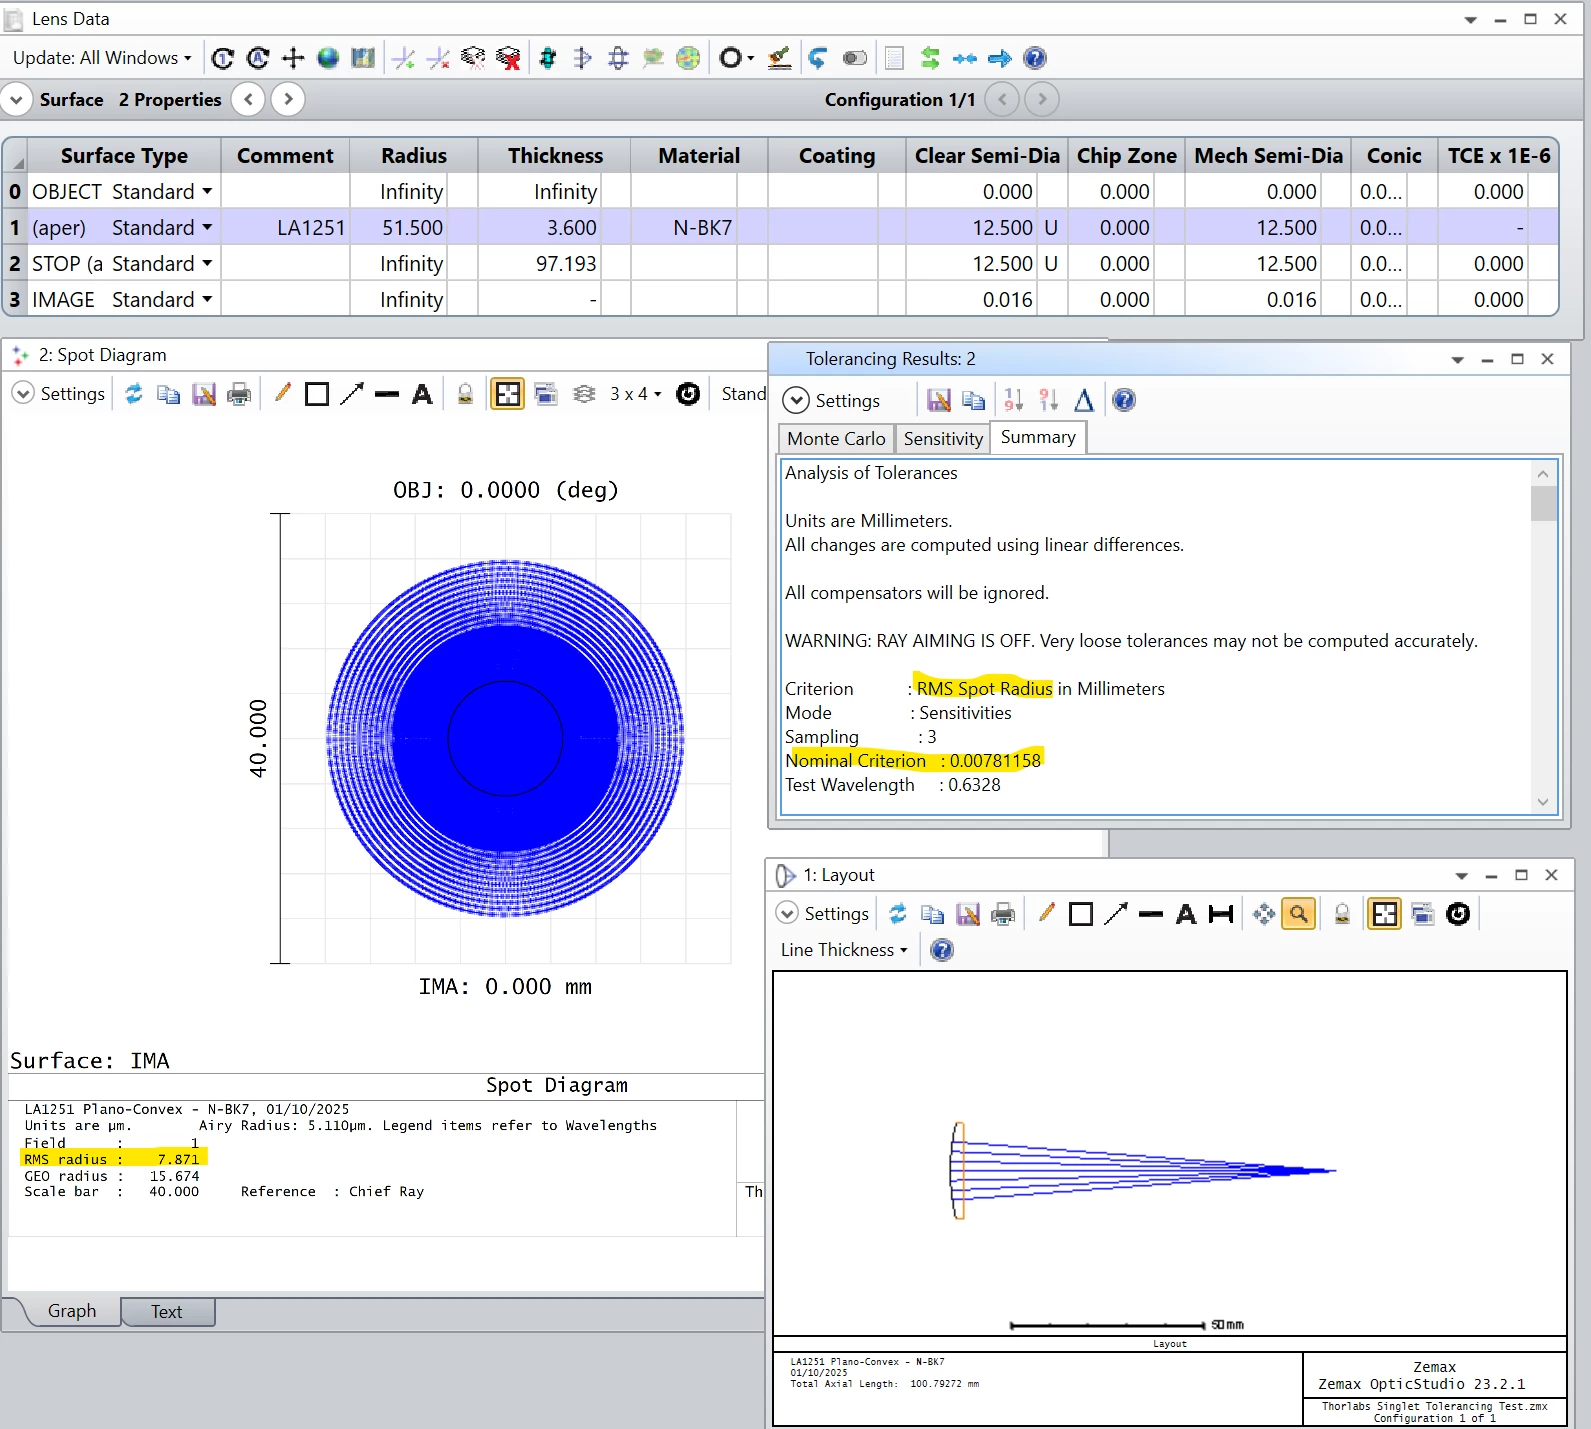
Hexapolar pattern with ray density 10 in the spot diagram is not the same as sampling value of 10 in the tolerance analysis. Increase the ray density in your spot diagram to see the RMS spot radius decrease. Eventually it should converge around the same value as the tolerance analysis.
Spot Diagram: Ray Density The Ray Density specifies the number of Hexapolar Rings to be traced if a Hexapolar or Dithered Pattern is selected, or the Number of Rays across the Width and Height if a Rectangular Pattern is selected. The more Rays traced, the greater the accuracy of the RMS Spot Radius, although the computation time increases. There are 6 Rays in the first Hexapolar Ring, 12 in the second, 18 in the third, and so on. The Ray Density Minimum Value is 3.
Tolerancing: Sampling: Sampling is used to set how many rays are traced when computing the tolerance criterion. Higher sampling traces more rays, and gives more accurate results. However, the execution time increases. If the selected criterion is RMS spot or RMS wavefront, then the sampling value is an integer that refers to the number of rays traced along a radial arm of the pupil in the Gaussian quadrature technique (see "Selecting the pupil integration method" for a description of this technique). The number of arms is always twice the number of rays along each arm.
Thanks! Indeed, increasing the sampling in the spot diagram brought the RMS value close to the one in the tolerancing tool, but I had to increase a lot (200)!
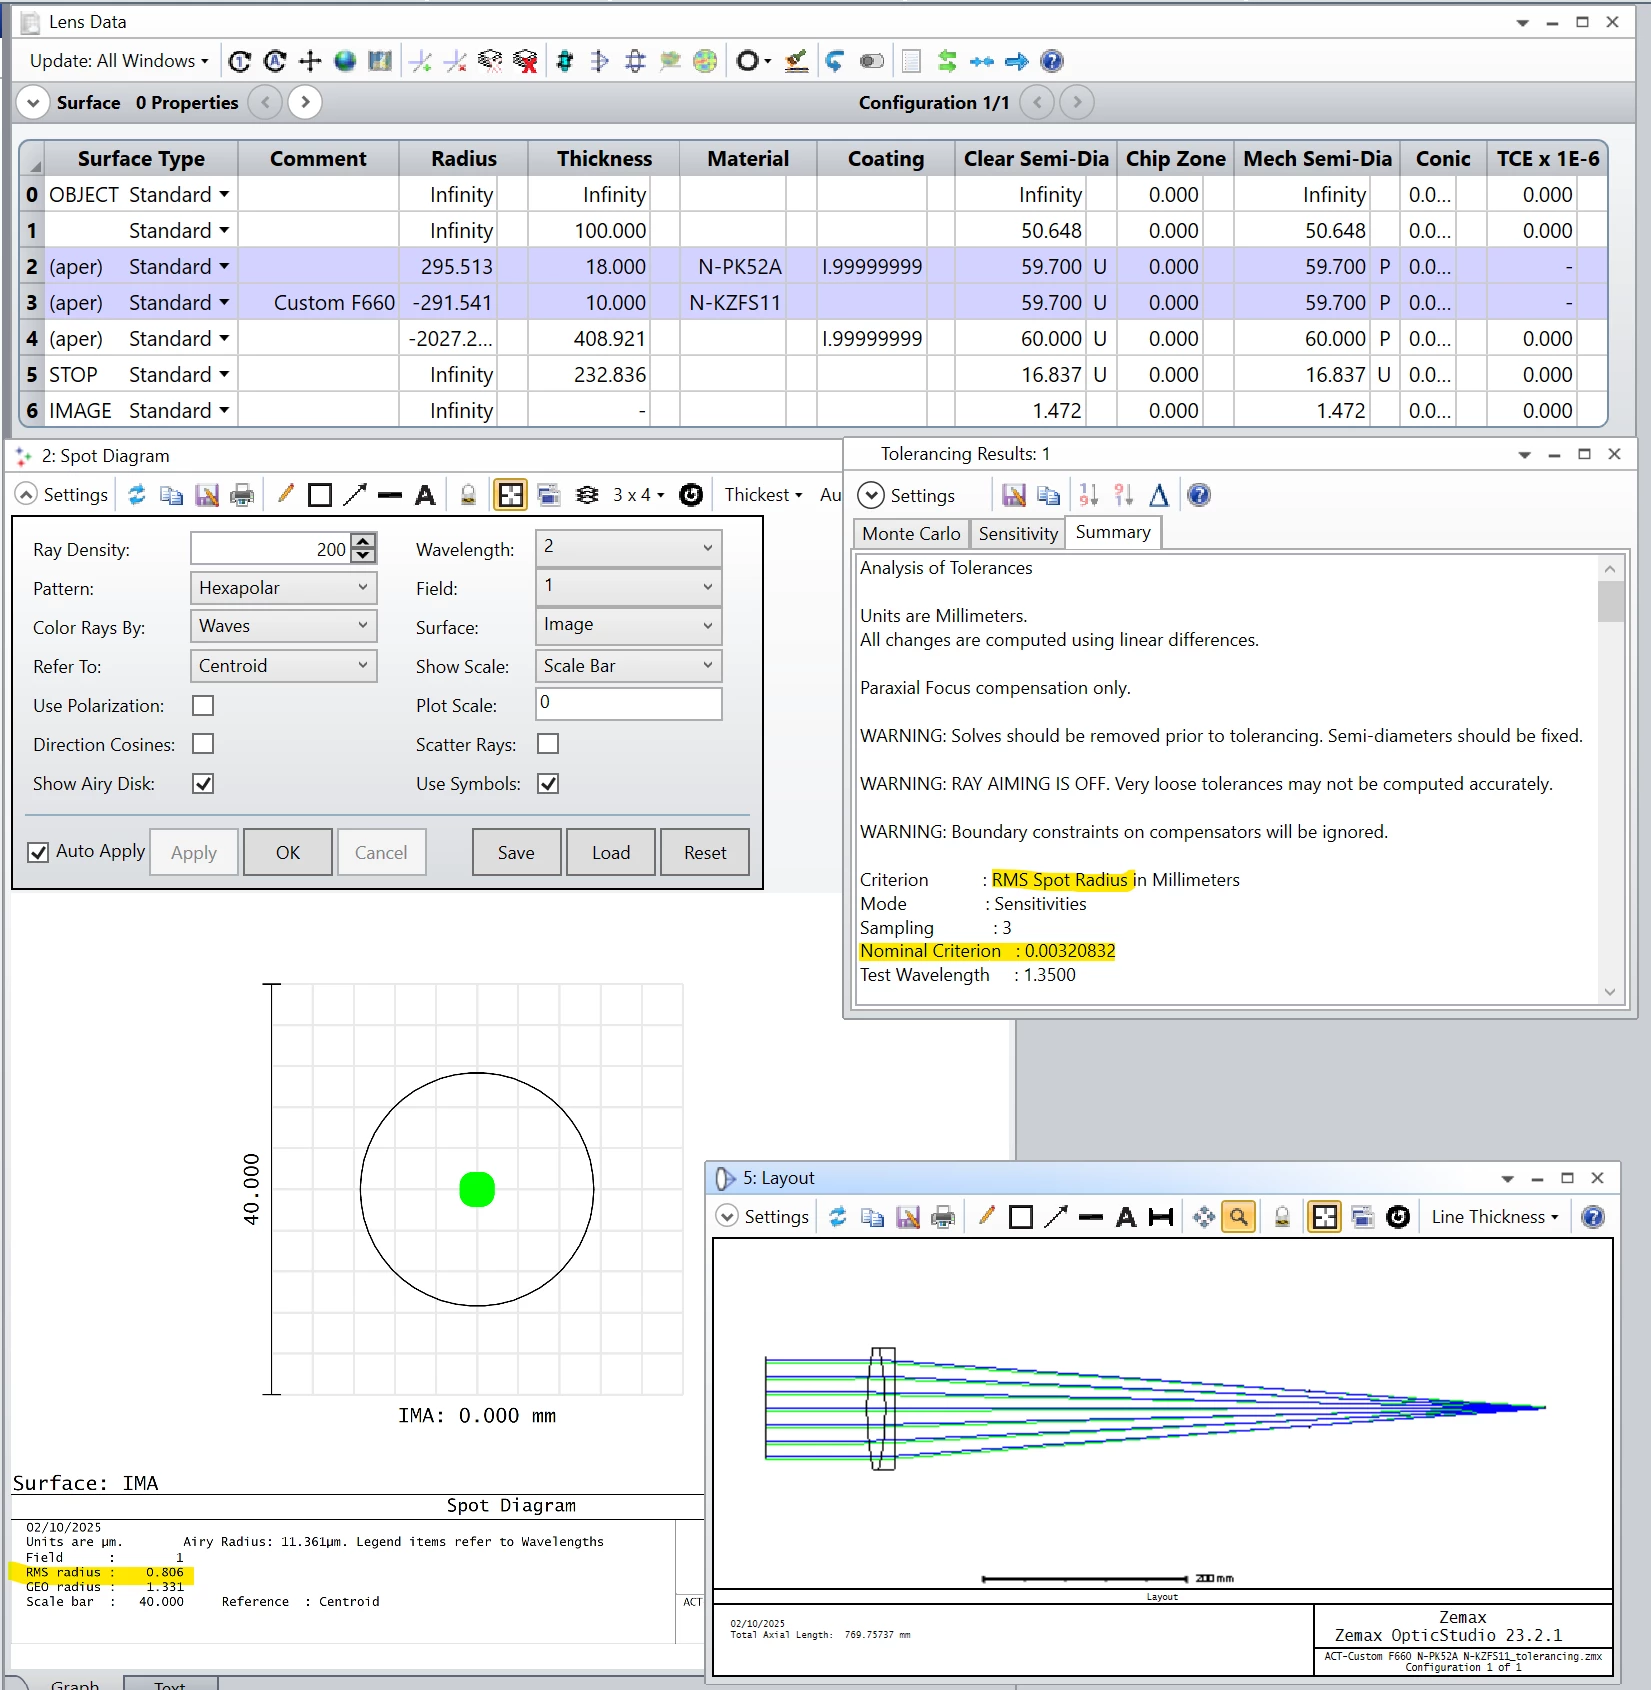
Well, today I restarted with the file on which I actually need to compute tolerancing, an achromatic doublet, and I was unable to get the same values in the spot diagram and in the tolerancing criterion. See capture below…
So it is a bit difficult to trust the tolerancing results if I don’t really understand what the criterion value is.
Any ideas?
Julien
It’s hard to say exactly without seeing the wavelengths and fields in your file, but it probably comes down to those settings are not the same between the spot diagram and tolerancing.
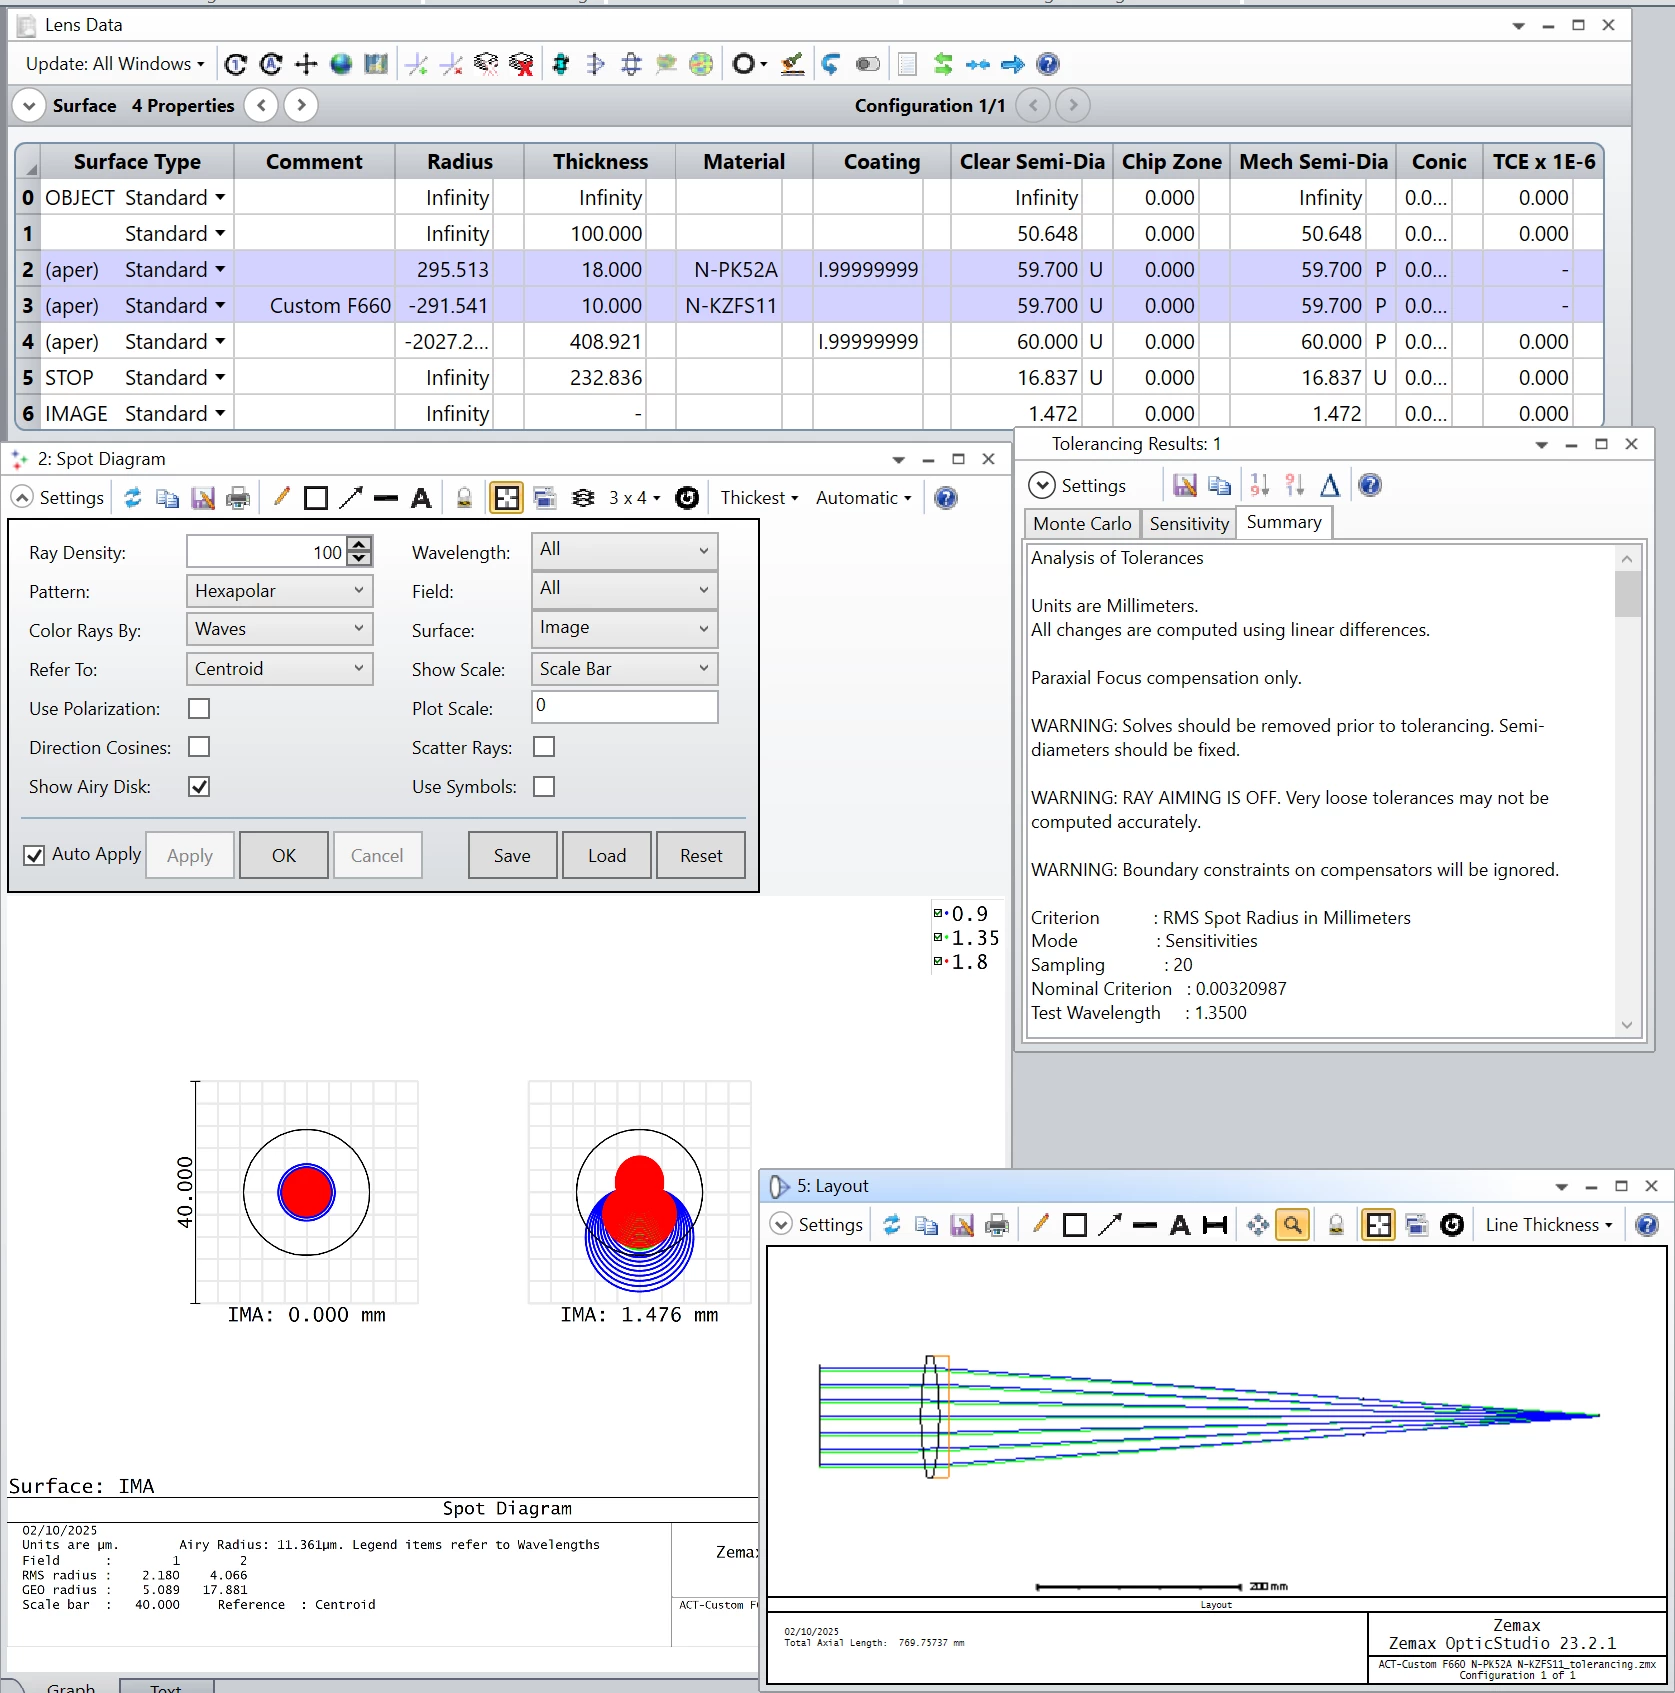
Your spot diagram is only showing 1 field and one wavelength, so the RMS radius is calculated based on those settings. The nominal criterion in the Tolerancing Results takes all fields into account. Try changing your spot diagram settings to include all wavelengths and fields and you should see better agreement.
Makes sense. I put the 2 fields and all wavelengths in the spot diagram, and get 2 RMS values. The one in the tolerancing tool is in between, so it is better but still a bit difficult to analyse. By the way, changing the value of the test wavelength doesn’t change the criterion value.
Then I simplified the file and kept only one field and on wavelength, now the values in spot diagram and tolerancing tool are very close: 0.8 microns.