
Hello.
I opened this thread because I want to discuss the Overlay Monte Carlo Graphics feature. This might be a long introduction.
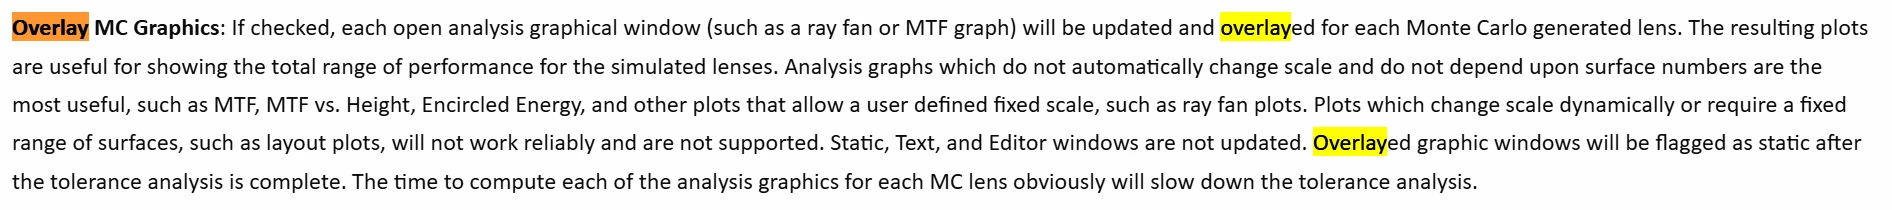
Until now, I understood the Overlay Monte Carlo Graphics feature to be purely for overlaying the results of repeated Monte Carlo runs onto open analysis windows—Spot Diagram, RMS vs Field, Diffraction Encircled Energy...etc. I think some of you might agree.
However, the Optics Studio Manual does not provide any description matching the details mentioned above. It explains its usefulness with a vague expression: "The resulting plots are useful for showing the total range of performance for the simulated lenses."
I found this difficult to interpret, so I actually ran a tolerance analysis and compared the results one by one against the MC_case number.
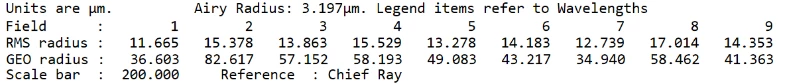
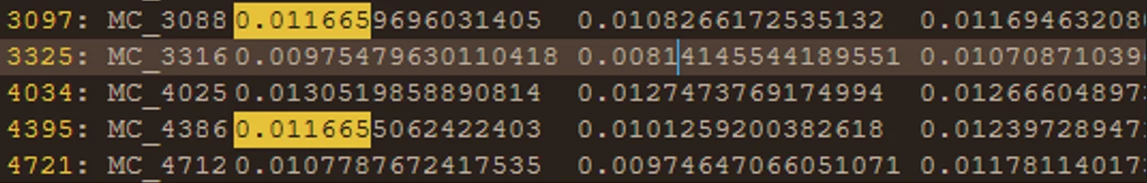
I have attached two images. As you can see from the pictures, the Field 1 value for lines 3097 and 4395 is 0.011665, which you can understand matches the image attached above. However, the other fields show completely different values.
This result is as if each field in the currently overlaid Spot Diagram was individually picked and brought over from its respective Monte Carlo Case.
Yes, it's as if you are picking cards one by one from a deck to build a Royal Straight Flush based on a specific spade.
I wasn't sure how to accept this fact, so I contacted technical support. Tech support's answer is that the current overlay values are calculated and retrieved from the Merit Function via the RSCE operand.
The question that remains is, what system is being calculated by this RSCE? What specific values within the tolerance range are causing the system to be changed or modified to be expressed this way?
Regarding this, I would like to share your opinions, thoughts, and reasoning.
Thank you.
-
I initially thought "Overlay Monte Carlo Graphics" overlays the complete results from each individual Monte Carlo run.
-
However, my analysis shows the overlay plot is a image that is seemingly picking individual field data (like spot size) from different MC runs, rather than showing the full results of any single system.
-
Technical support attributed this to the RSCE operand, but The question that remains is, what system, reflecting which specific values from within the tolerance range, this operand is actually calculating to produce this specific composite plot?
