Hi all,
I think I found a bug in the RMS wavefront error plotting tool - initially saw it in the 2025 R4 version, but I downloaded the latest 2026 R1 and it’s still there.
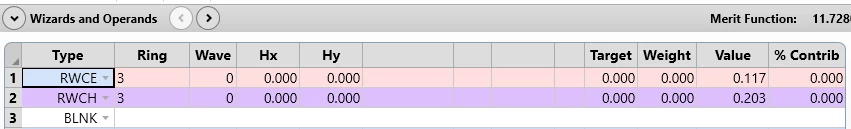
I was working through some analysis and noticed a discrepancy in the RMS wavefront error values reported on the plot vs evaluation in the merit function. As seen in the example below, the merit function operand RWCE was reporting a fairly different value compared to the plot. Initially I assumed this was due to sampling, but the difference persisted (I also tried comparing rectangular array vs Gaussian quadrature).
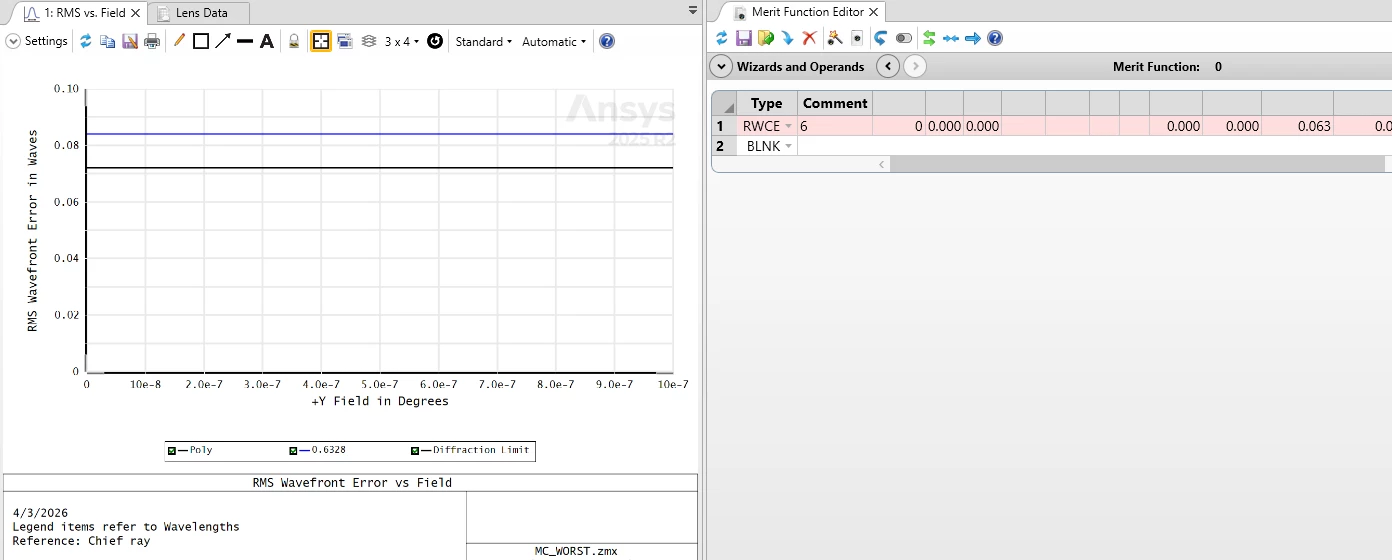
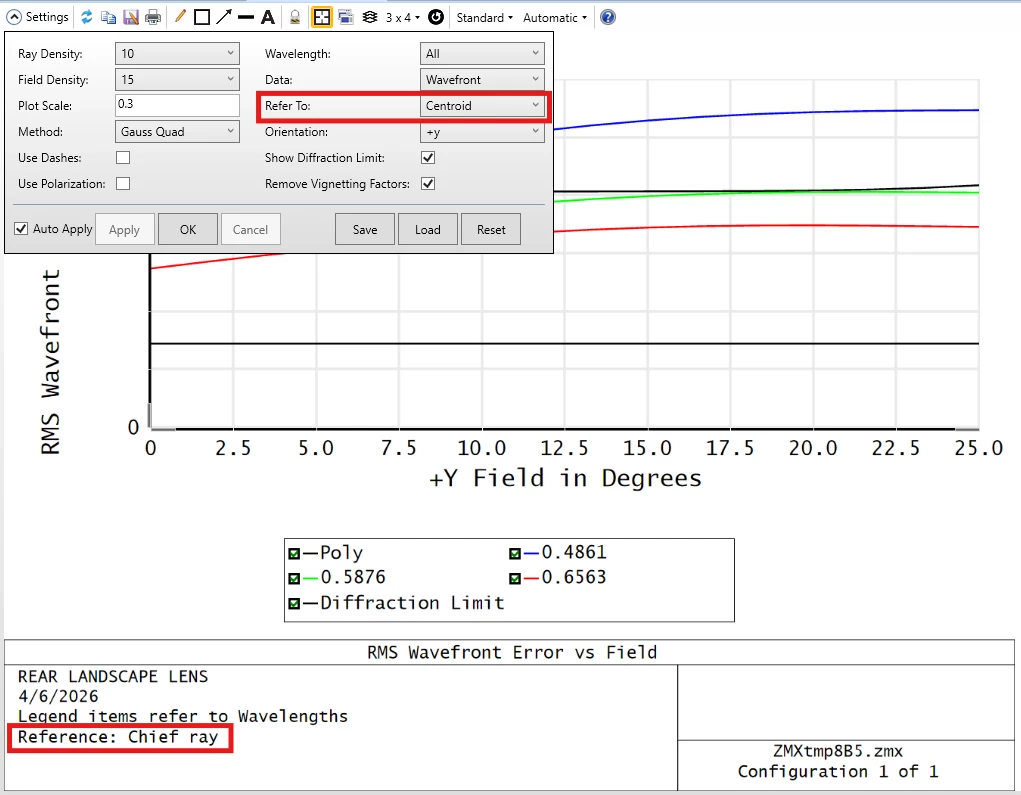
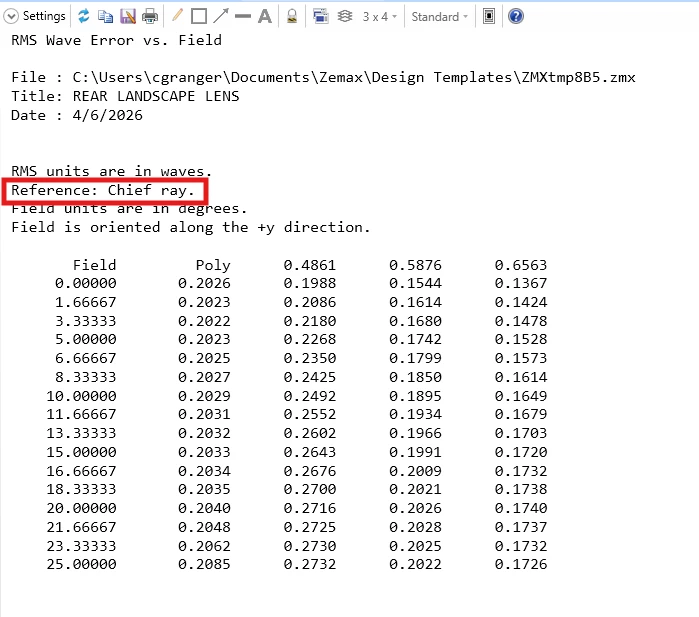
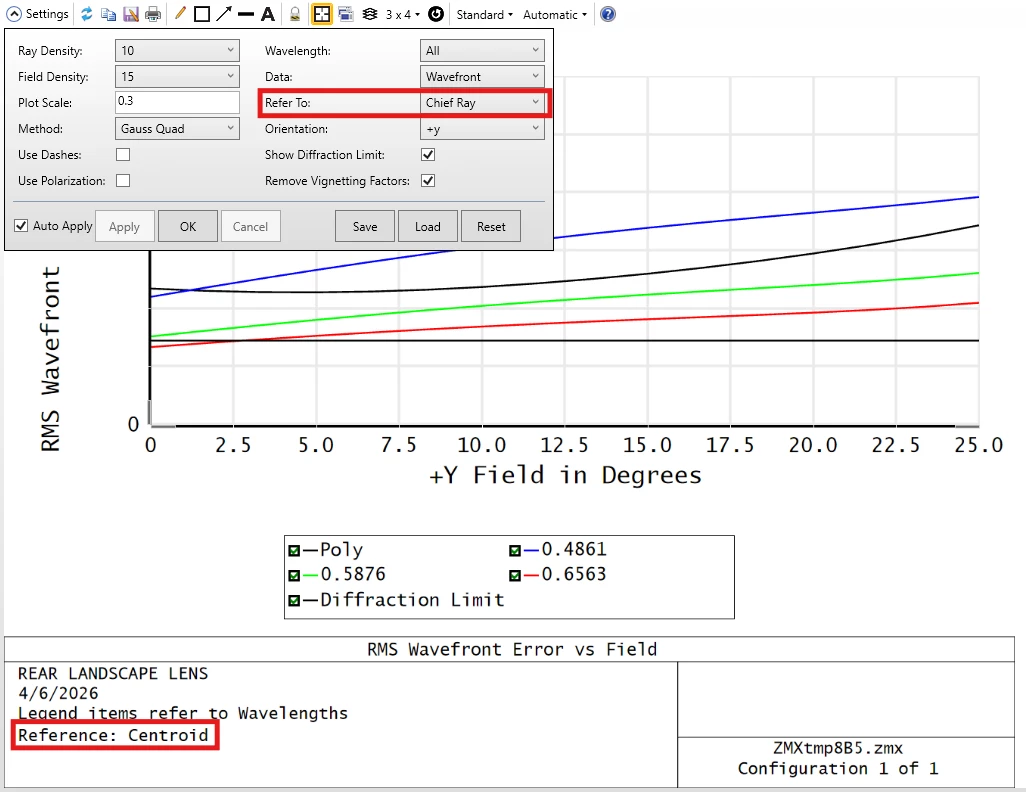
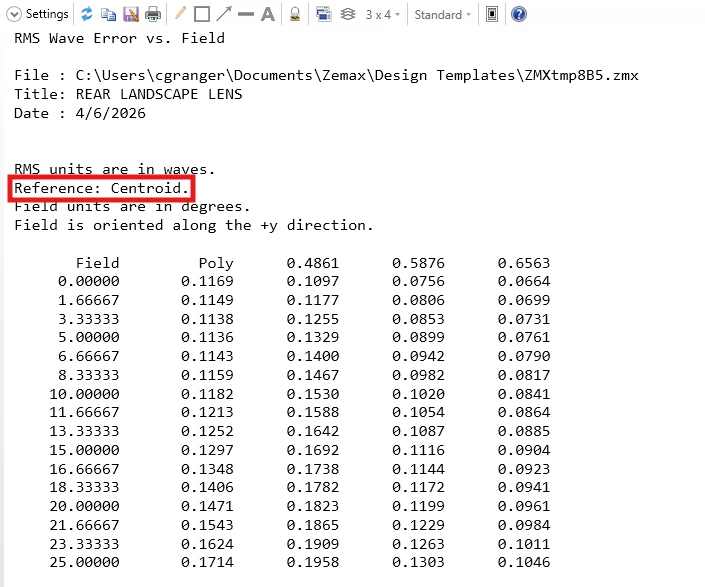
Next, on a whim, I evaluated the RWCH (chief ray reference) operand and noticed it did match the plot value, which I found odd, because the default for the plot is to reference the centroid. Looking closer at the plot, I noticed that although Centroid is selected as the reference in the settings, the title block reports “Reference: Chief Ray”. Likewise, when Chief Ray is selected in the settings, the plot shows “Reference: Centroid”.
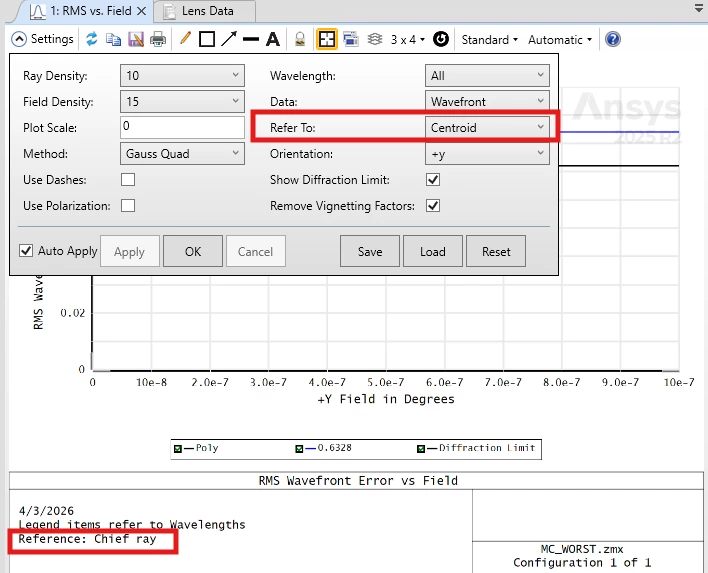
At this point I wasn’t sure what to trust, but after digging a little more I convinced myself that the merit function operands were reporting the correct values, but the plots are displaying incorrectly (Chief Ray shows Centroid, Centroid shows Chief Ray).
Hoping someone else can validate this or otherwise tell me if I’m missing something. I probably wouldn’t have noticed if I weren’t digging through MC files that had some coma present to introduce a difference between the centroid/chief ray reference evaluations.
Thanks,
Charlie