Hello
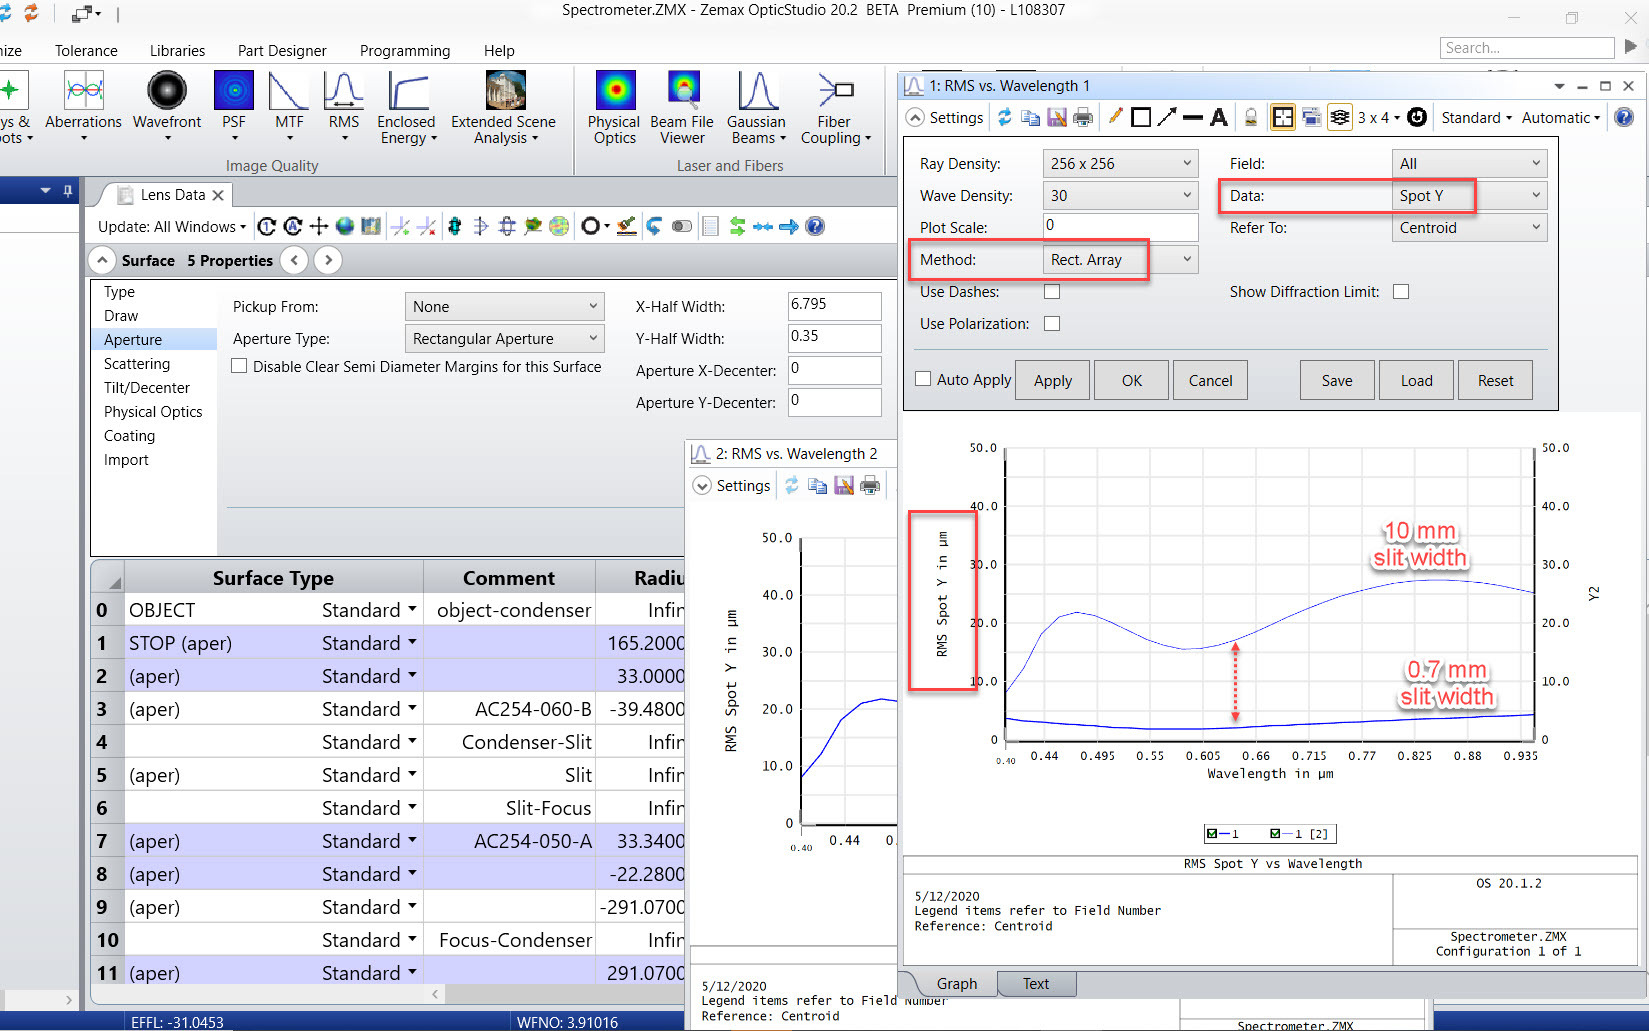
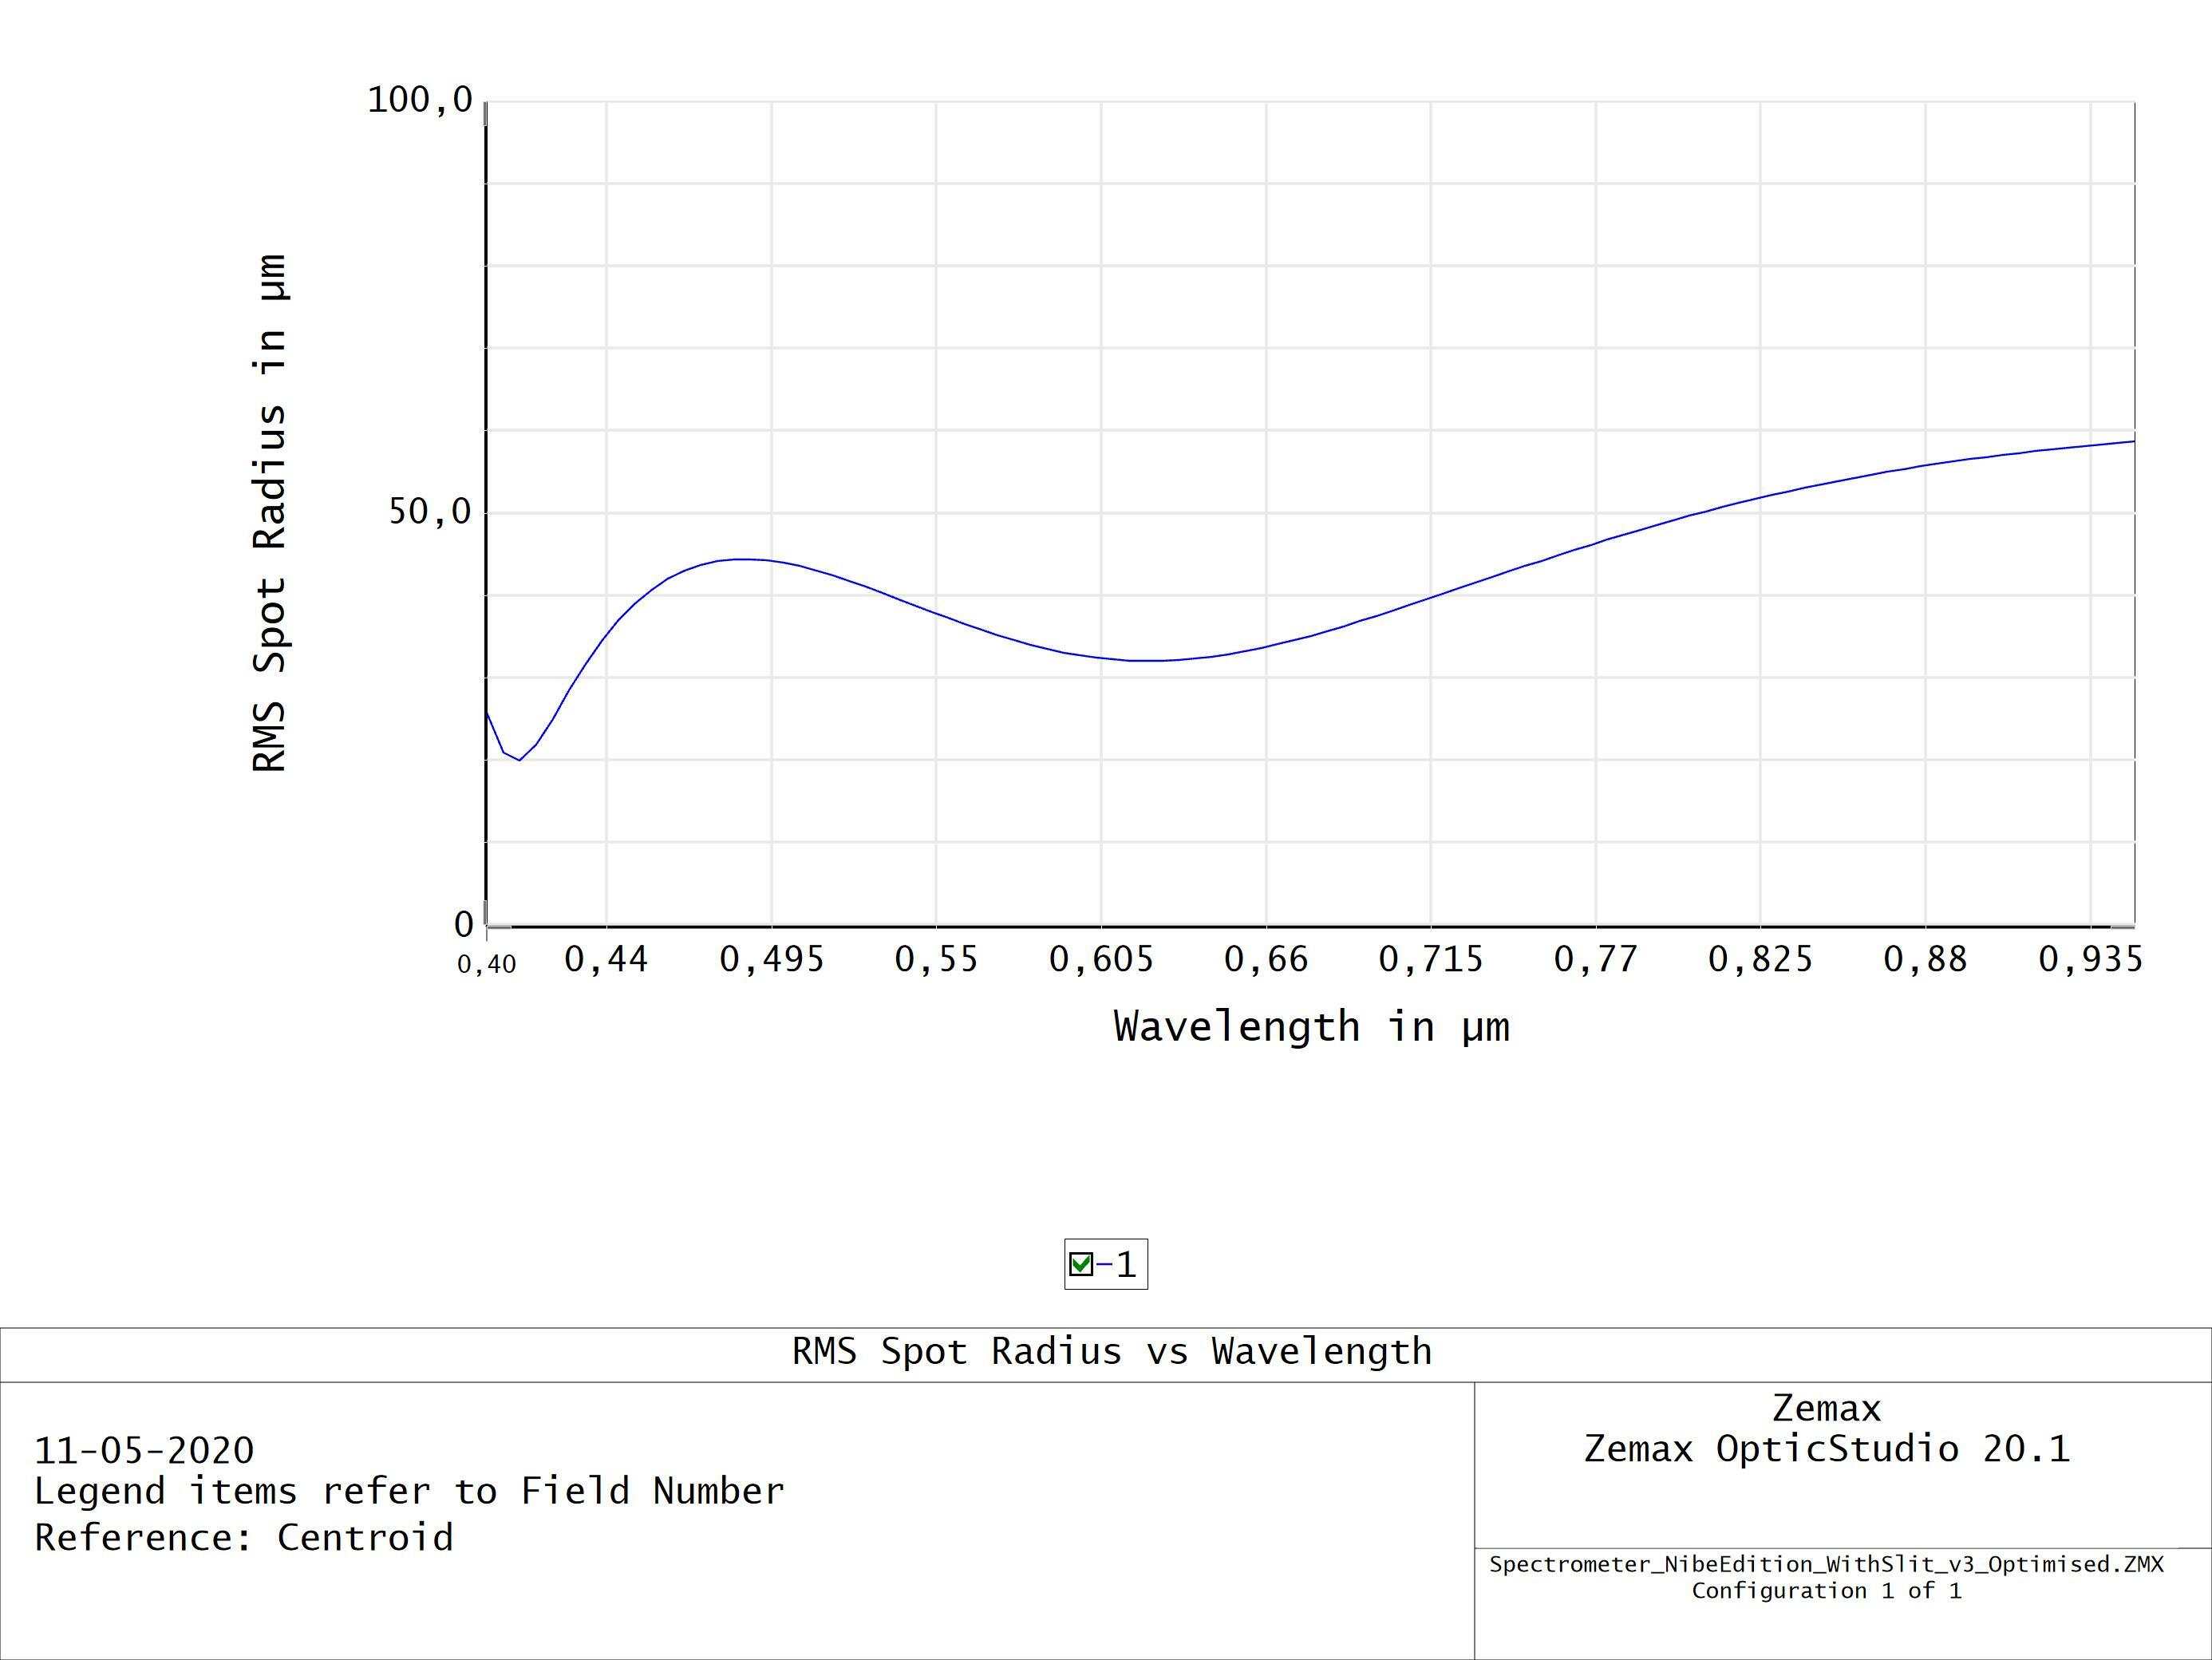
I am trying to build a spectrometer and I’m interested in the spot size at different wavelengths and at different slit-openings. However, when using the RMS/Wavelength plots the slit width do not seem to affect the RMS spot size, while the spot diagram says otherwise. Is there any way to measure the spot size (preferably the width along the Y-direction) which takes the slit width into account?
0.7 mm slit width

10 mm slit width
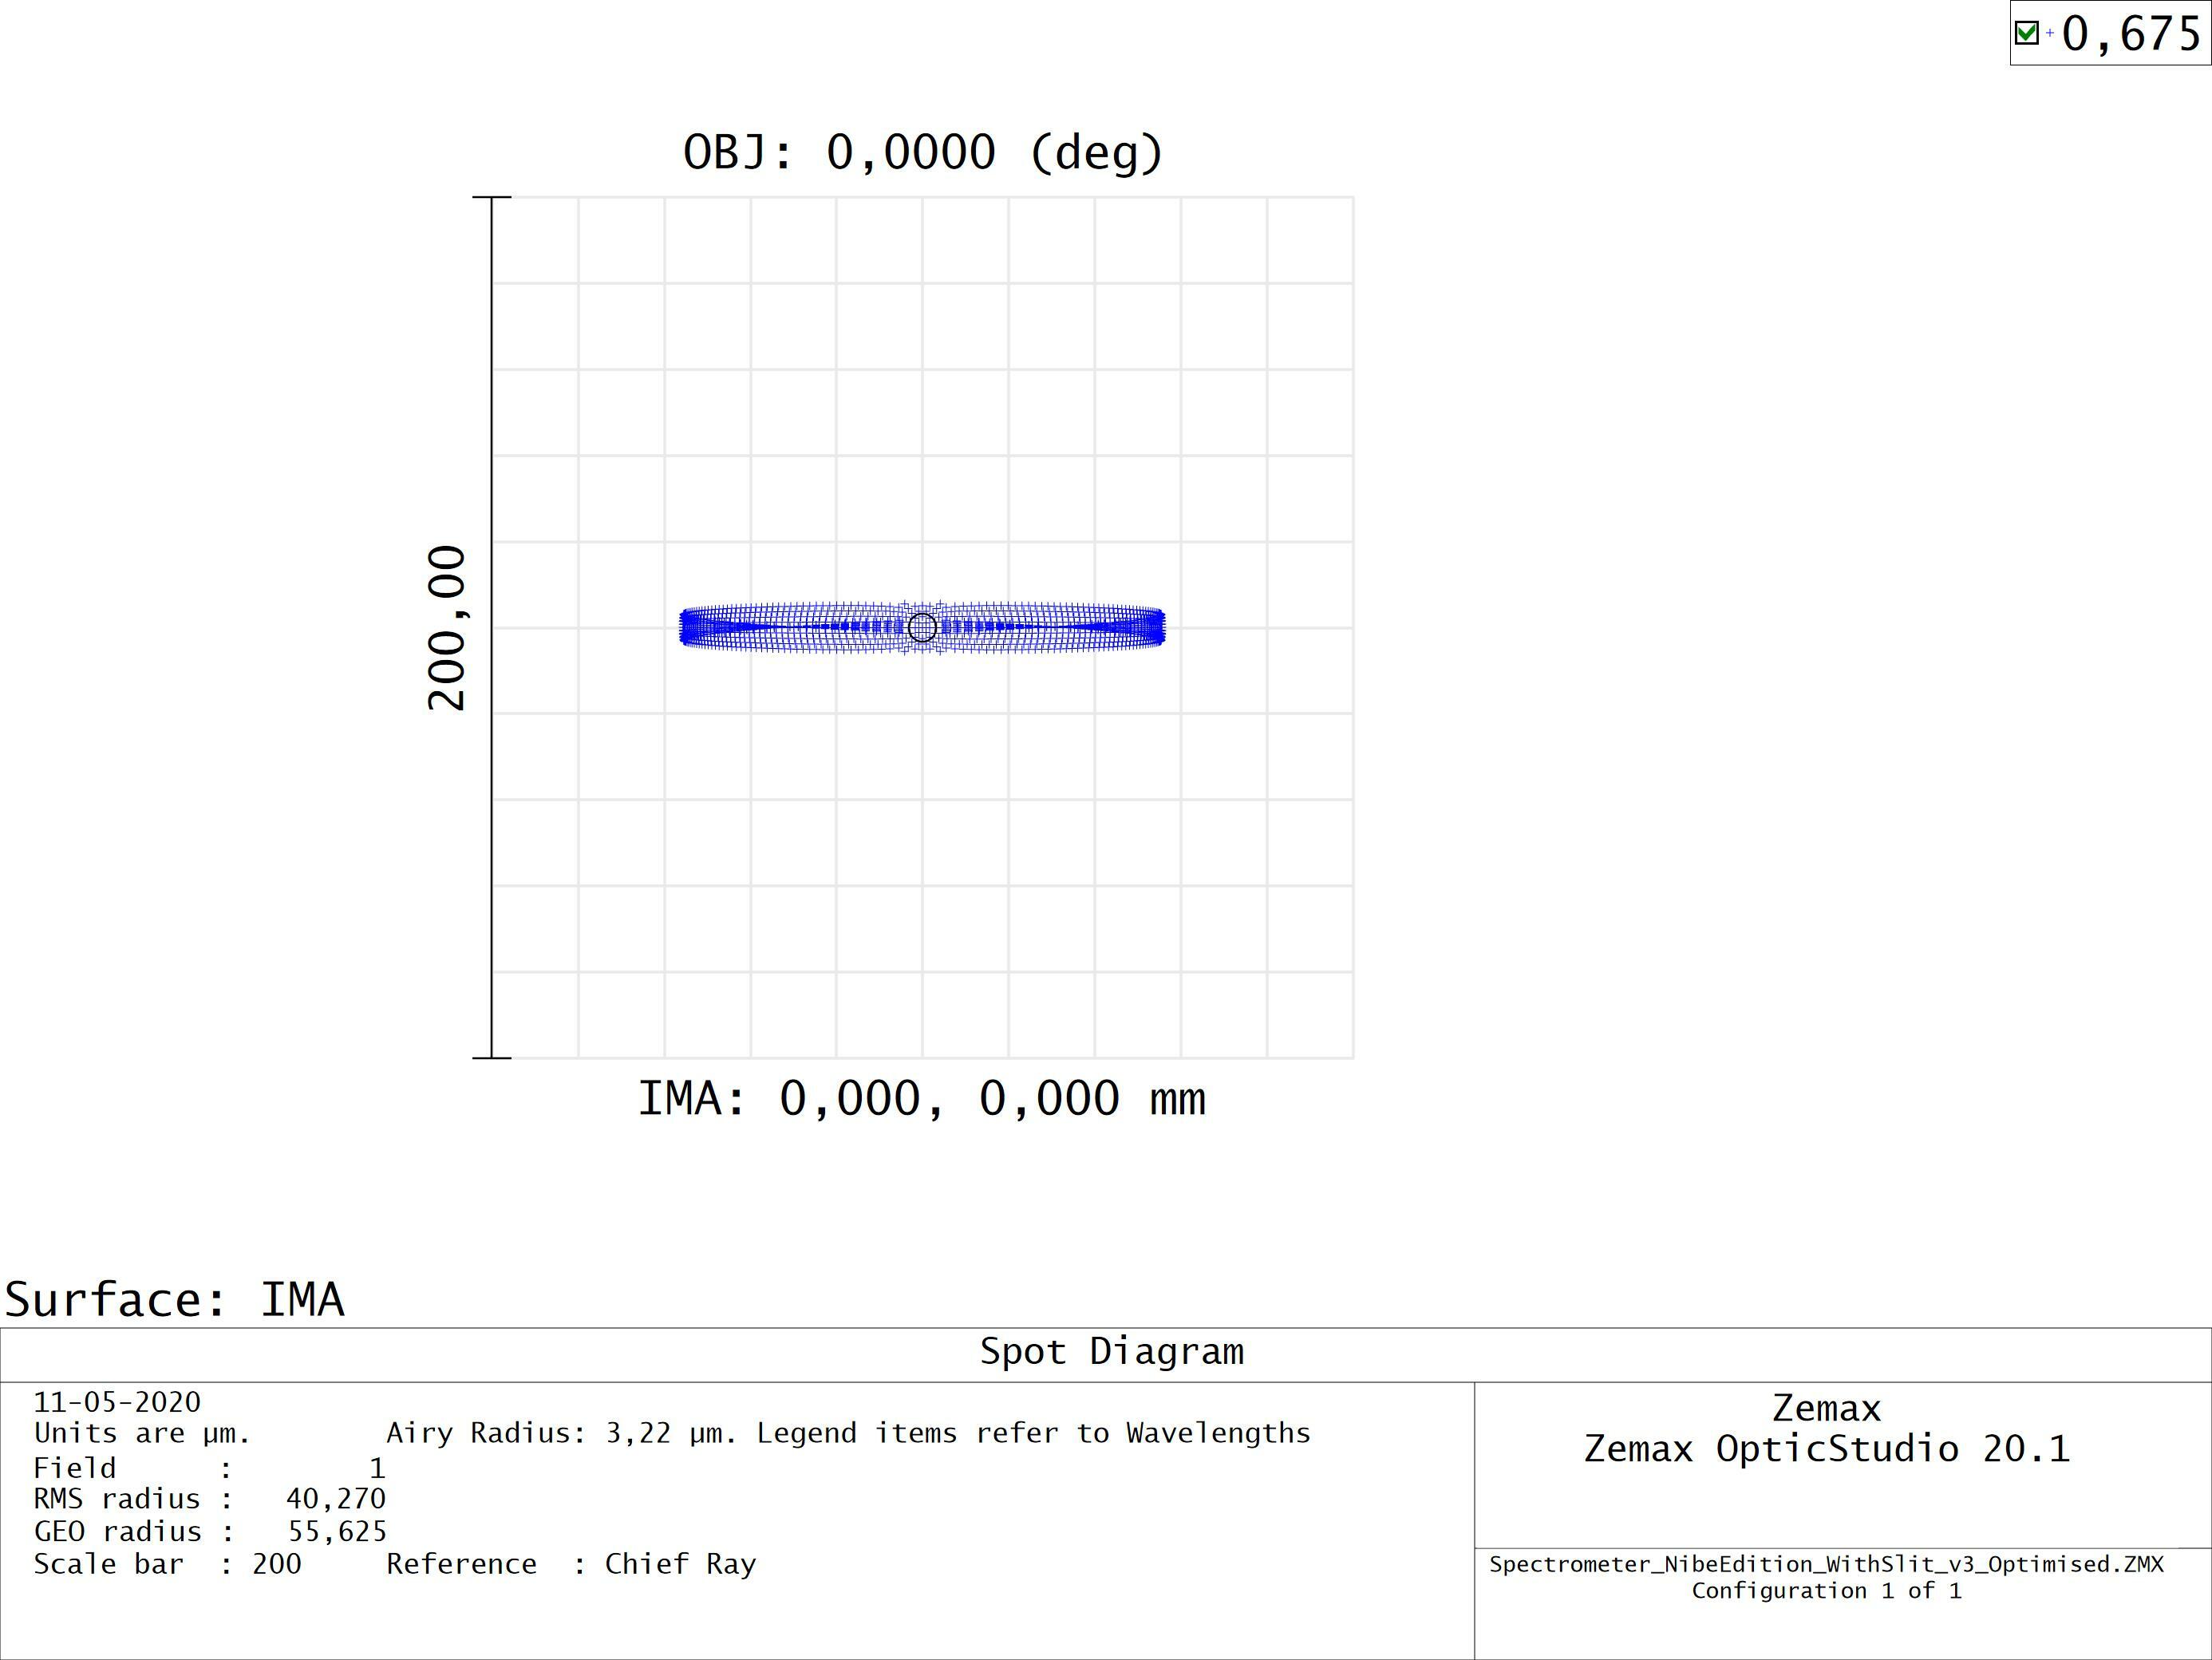
0.7 mm slit width
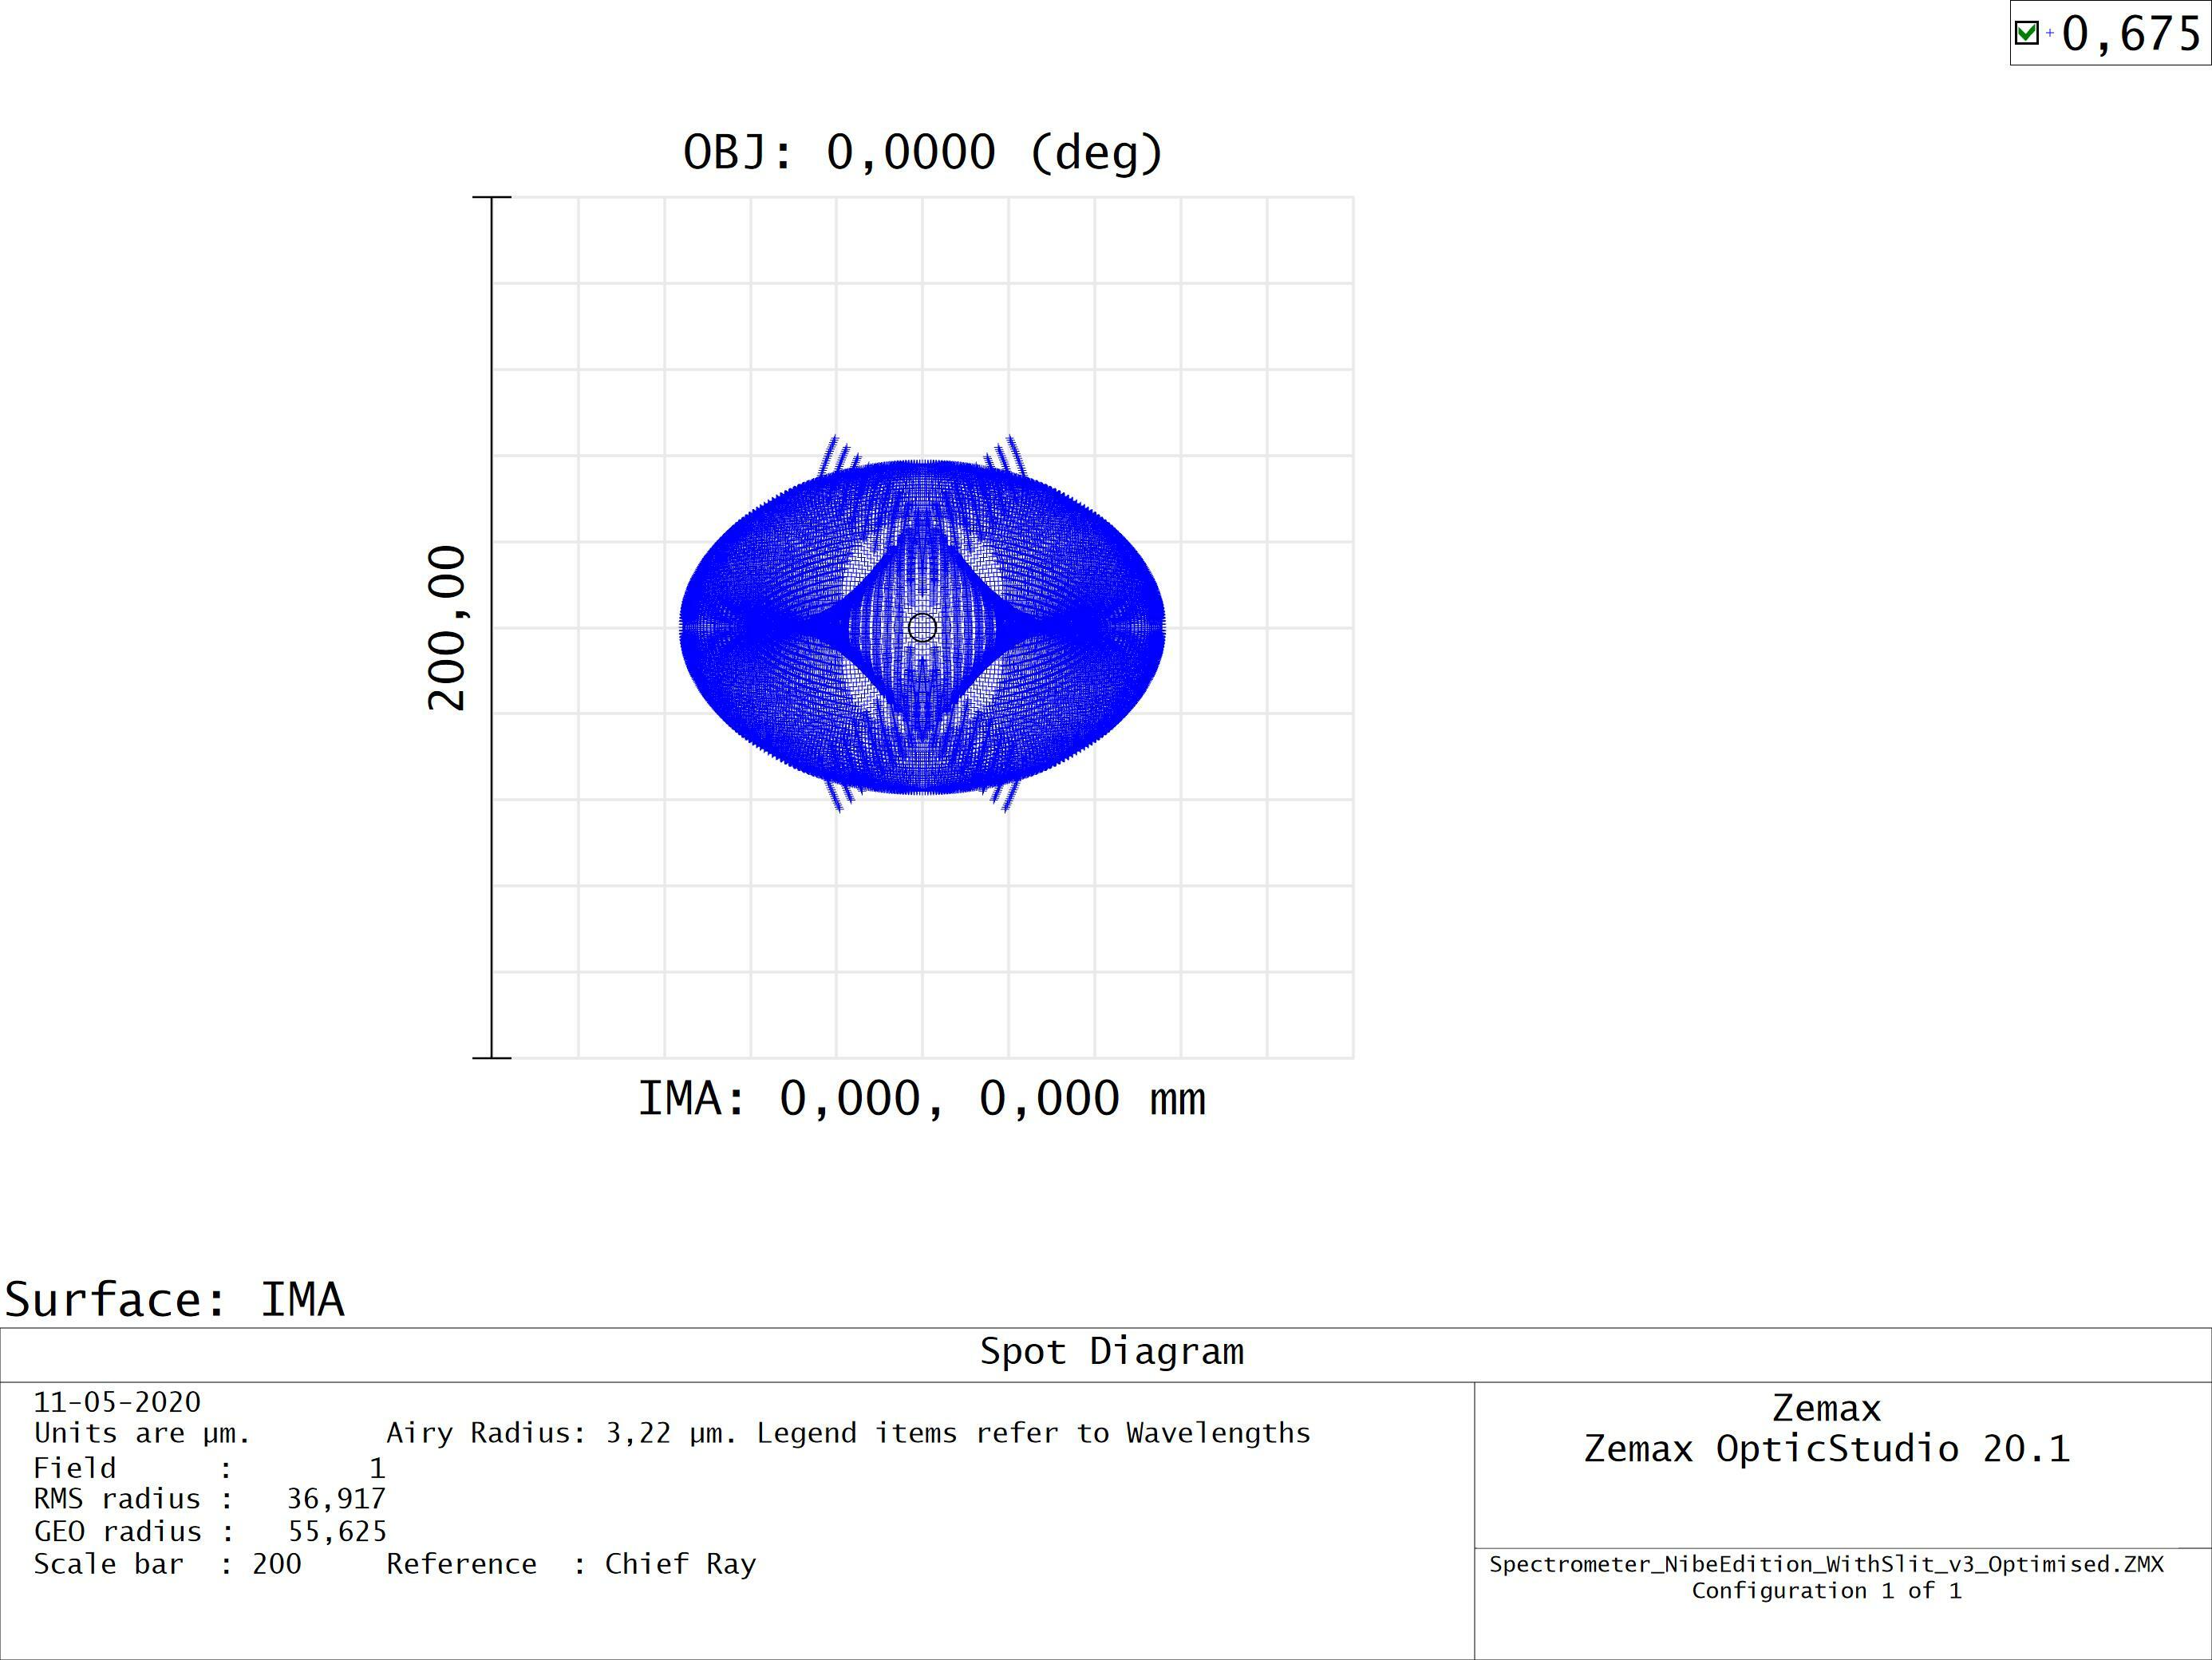
10 mm slit width
Hope you can help
Best regards
Mads Larsen