it is mainly used for gratings design (as a consultant told me)
is it any other method to get the spectrometer wavelength- efficiency in sequential mode ?
Best answer by Sandrine Auriol
Hello Yang
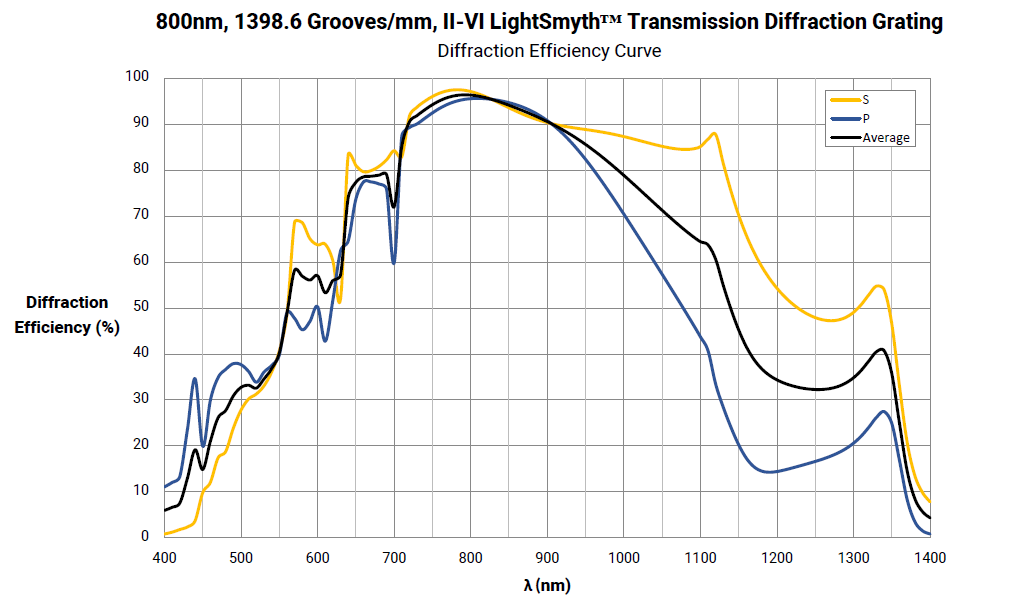
The spectrometer efficiency is often linked to the grating efficiency itself which is why the RCWA method is interesting.
The Geometric Image Analysis has an associated merit function operand called IMAE that returns an efficiency, so you could scan for different wavelengths and return that efficiency using the Universal Plot 1D. It is basically what is done in the RCWA article. I can show you how I would do it in that article if you want: https://support.zemax.com/hc/en-us/articles/1500005578862-How-to-build-a-spectrometer-implementation? Let us know.
Hi Sandrine,
Sorry for late replying, and thanks for your advice.
The spectrometer efficiency is often linked to the grating efficiency itself which is why the RCWA method is interesting.
Currently, I consider my gratings as a ideal one (just ○○lp/mm, nothing about the shape of the profile), and then will take the manufactured gratings efficiency into consideration.
I am really interested in IMAE operand to calculate the wave-efficiency ! and I am looking forward to reading your update. Meanwhile I will try it myself also, :-).
By the way, I have read the RCWA tutorial but, difficult for me to understand, and since my Optics studio is a professional version, pity that I just cannot do a design or simulation using the RCWA method introduced. And that’s why I am looking for other method instead.
The spectrometer efficiency is often linked to the grating efficiency itself which is why the RCWA method is interesting.
The Geometric Image Analysis has an associated merit function operand called IMAE that returns an efficiency, so you could scan for different wavelengths and return that efficiency using the Universal Plot 1D. It is basically what is done in the RCWA article. I can show you how I would do it in that article if you want: https://support.zemax.com/hc/en-us/articles/1500005578862-How-to-build-a-spectrometer-implementation? Let us know.
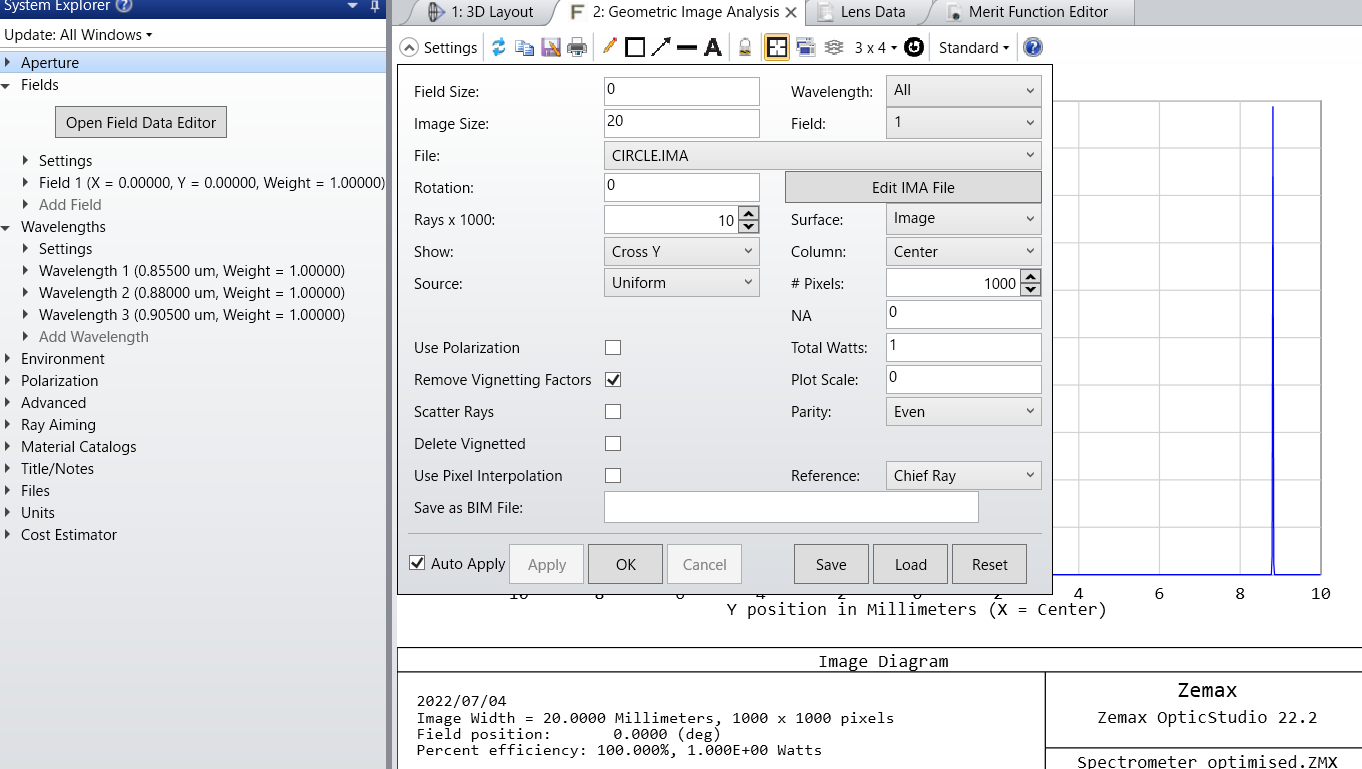
set the Geometric Image Analysis , and save the settings
set Merit Function Editor --IMAE surf=22, field =1,field size =0,data =0, wave =1 / 2 / 3
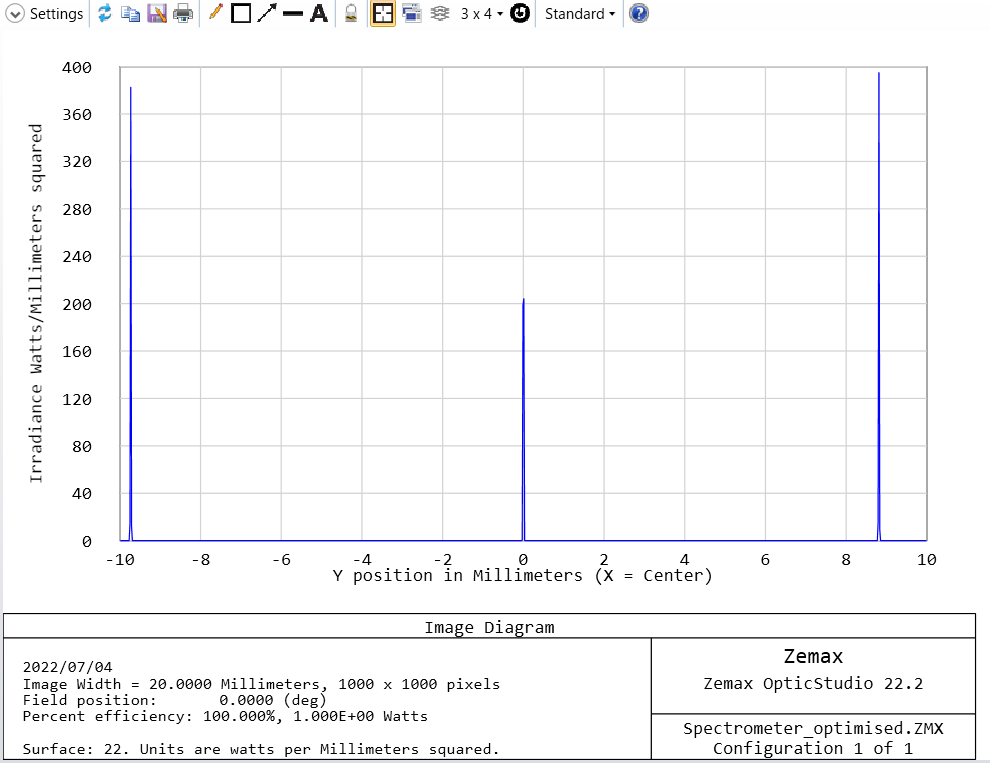
I got the diagram of wavelength- irradiance like this, but the IMAE operand values are all 1 (100%). I know some setting is wired...and as I tried different field size, the value of IMAE changed.
My question is
In my understanding Field size = 0 mean the light source size is 0. And in Geometric Image Analysis it is used to simulate the ideal condition?
Given field size =0, why the difference happens between image diagram and the value of IMAE?
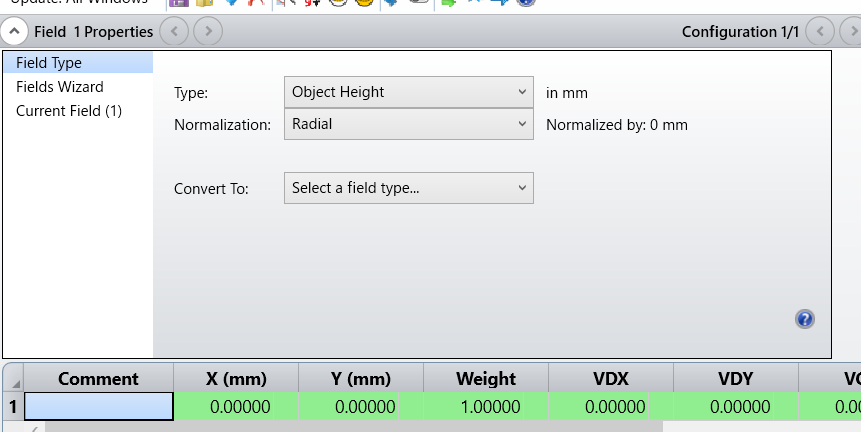
In reality, since the light source has size, in this case, a slit size shall be used to field size, say Field size = 0.02(20um), is my understanding right? (in system explorer, the fields shall be set as object height )