Hi,
My system is afocal, currently with a single center field.
Due to angle change of one of the elements in the optical path, the spot is shifted from (0,0) in the spot diagram.
I'm trying to create a graph of this shift as a function of the element angle, but can't seem to find a suitable merit operand.
Is there an operand similar to RSCE/RSCH with respect to the vertex?
Thanks in advance,
ILAN
Page 1 / 1
Hi Ilan,
If I understand correctly, you are trying to measure the spot shift. For the axial ray, you could use REAX and REAY. For the centroid location you could use CENX and CENY. (These are not similar to RSCE/RSCH in that those measure spot radius, not location.)
Kind regards.
David
Dear David,
Thanks so much for your helpful reply.
All the best,
ILAN
Thanks so much for your helpful reply.
All the best,
ILAN
Hello,
Relating to the previous issue I had, described above,
I was able to generate a graph showing the spot shift (equivalent to wavefront tilt) as a function of the system parameters.
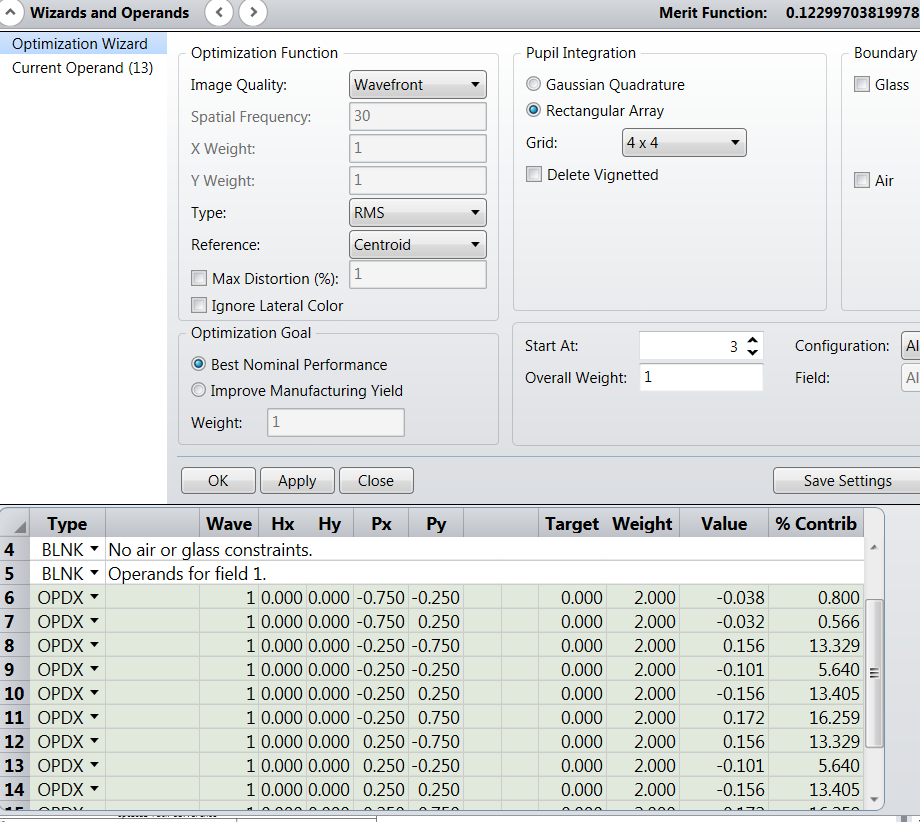
I'm now trying to extract the complementary information - a graph that will show the RMS wavefront error with the tilt REMOVED.
I fount the operand OPDX which does exactly that, at least according to the description. However it has some restrictions of use, and I can't use it to generate a "Universal Plot".
I'd appreciate some more help and guidance.
Sincerely,
ILAN
Hi Ilan,
I've never had occasion to do this, but but I can think of one way. The OPDX operands are similar to TRAC in that they are used as a group to measure image quality. You can use the merit function wizard to produce a merit function for optimizing OPD. This will produce a merit function with a proper list of OPDX operands. (Use Rectangular Grid if you need to cover the pupil.) Then you need to decide what ray you want to graph OPD for, where rays are defined by their field and pupil intercepts. Or you could use math operands like QSUM to build a valu you want to graph. As I said, I have never done this. It might be there is some better way.
Best regards,
David
Dear David,
Once again your comprehensive answer is highly appreciated.
I will try and see if it works.
Thanks again,
ILAN
Once again your comprehensive answer is highly appreciated.
I will try and see if it works.
Thanks again,
ILAN
Reply
Enter your E-mail address. We'll send you an e-mail with instructions to reset your password.