Hello,

I am currently working on a Zoom system. I would like to know whether it is possible to get a zoom curve plot directly through the software or not.

If possible please suggest ways to obtain the data points or plot with the help of the software.

Thank you.

Hi Parag,

I am assuming you mean “cam profile” by “Zoom curve”. If something else please specify.

I am not sure whether it is possible in Zemax or not.

But, our approach to get the cam curve is to copy the lens movements from the Zemax Multiconfiguration editor and use it in excel or Matlab for further analysis. 


Hello Chandan,

Thank you for the response.

I was basically referring to the cam profile. 

Please share some references to the above-mentioned technique. 


Hi Parag,

To get the cam profile, one reference has to be taken (maybe front fixed lens) and movement of variatior and corrector lens has to be calculated from this reference. 

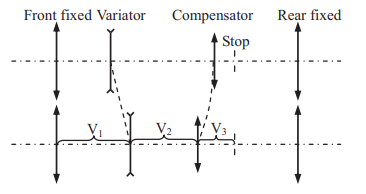
Example:

In above figure assume front lens is reference, with this reference, variator lens movement will be same as Si = V1 and compensator lens movement will be Ti = V1+Thickenss of variator lens + V2. V1 and V2 values can be found from Zemax MCE. To get cam profile you have to decide the total rotation of barrel (50, 90, 120 degree etc., it has to be optimised based on cam profile feasibility). Next step is to find the linear movement of variator lens per degree rotation of barrel (a = total angle of rotation/ total movement of variator lens). Based on this value (a) you can find out the barrel rotation for different variator lens positions (Oi = (lens movement (Si)  - initial position of variator lens (S1)] * a).  Since compensator lens will follow variator lens, compensator lens linear movement will also be same as variator lens (Oi). 

Where ‘i’ is the configuration number.

Above calculations can be imported into excel or matlab and cam profile can be plotted.

You can also plot the cam profile using ZPL given in attached link...

https://www.researchgate.net/publication/260941671_Optimum_design_of_cam_curve_of_zoom_system_based_on_Zemax


Thankyou.


I’m not sure that the description here tells me exactly what is needed, but it sounds like there is a way to use the ZPL to produce the output for post-processing. I would add that if you can write the macro in a way that returns a value to the ZPLM operand in the Optimization Editor, you can probably set up the Universal Plot to make graphs of the response.

If you’d like to share more details on what the process you’re working on involves, I’d encourage you to open a case with Zemax Support so we can look at your needs in detail.


Reply