I got some problems with units and normalization with the radial grating:
Lets say my grating equation is d = 1872-9459r^1+23000r^2+…where the units are in microns.
How do I insert it with the correct units to the radial graitng parameters?
edit:
I try also grating equation with d = 0.41-3.21*r^1+12.53*r^2+...in milimeters where this series is very similiar to ~1/r, still, something is wrong...
Thanks,
Nadav
Best answer by David.Nguyen
Hi Nadav,
I’m not sure what you mean when you say:
something is wrong...
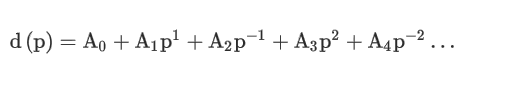
But this is what the Help File says about the Radial Grating:
d is the grating spacing (always in micrometers)
the Ai coefficients all have units of micrometers
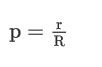
p is the normalized radial coordinate defined by
where r is the radial coordinate on the surface in lens units and R is the user defined normalization radius
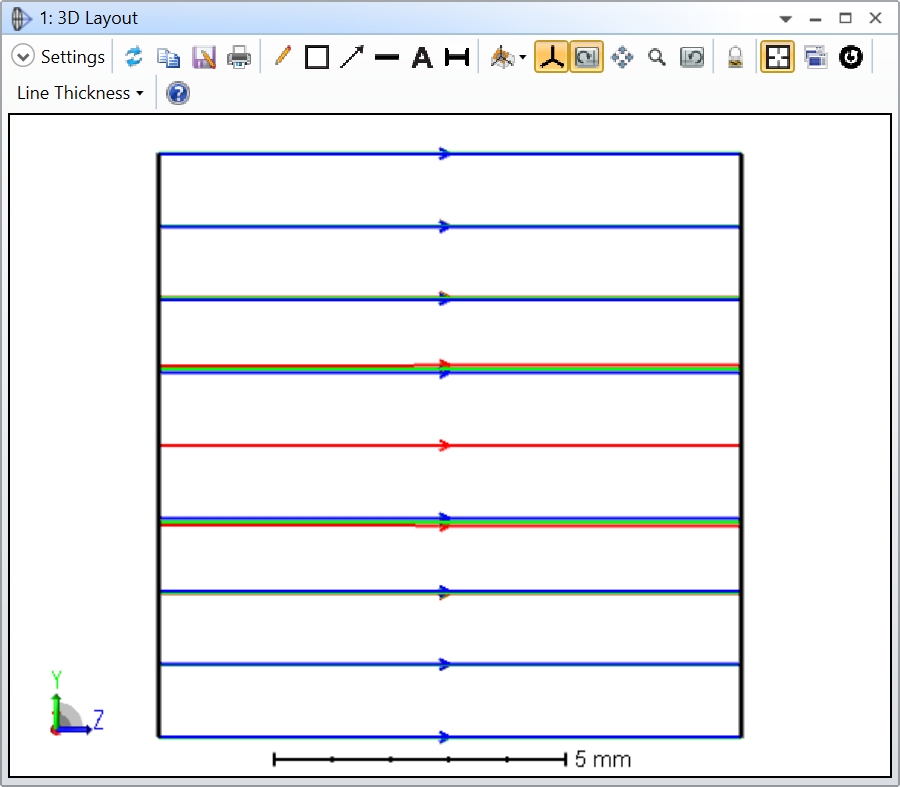
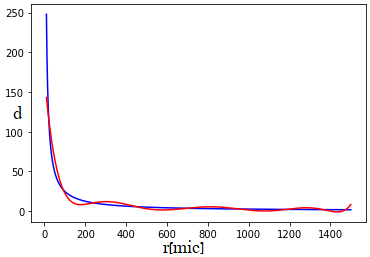
If your equation is already in microns, then you can just copy the coefficients into OpticStudio. I don’t know your Norm Radius and Wavelength, but I looked at your equation and found that d is roughly in the order of 1000 to 10 000 um. This means that your grating period is somewhere between 1E-3, and 1E-4 lines per um (I think the grating period is one over the grating spacing). Therefore, your diffraction angles will be quite small and hardly noticable in a 3D Layout. If I use a Norm Radius of 5.0 and use a Clear Semi-Diameter of 5.0 as well, this is what it looks at 0.55 um after 100 mm of propagation for diffraction orders +0 (blue), +1 (green), and +2 (red):
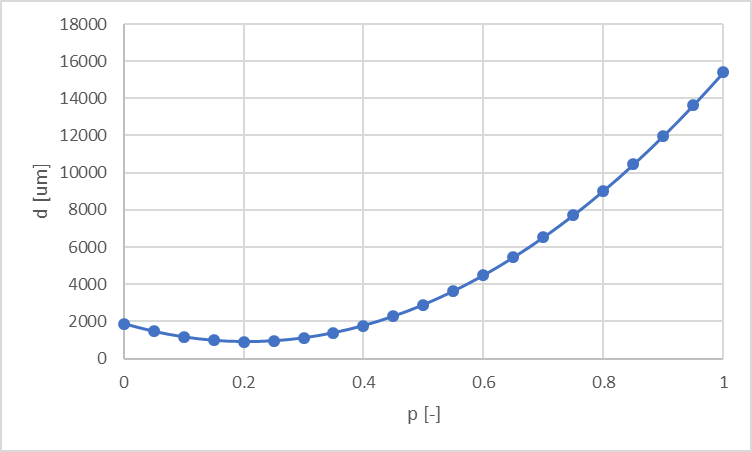
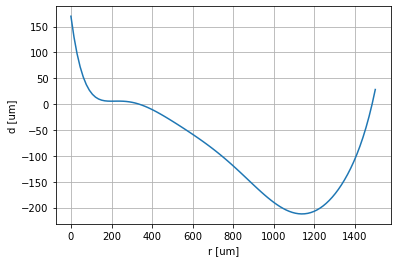
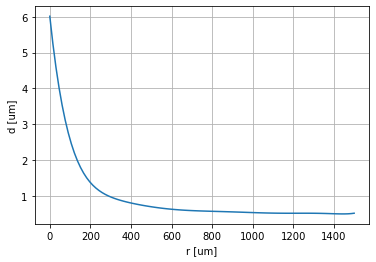
It sort of makes sense because your equation has a quadratic shape like so:
Therefore, the diffraction is closer on the optical axis because the spacing is smaller. On the edges (p = 1.0) it becomes so large that there almost isn’t any diffraction.
But this is what the Help File says about the Radial Grating:
d is the grating spacing (always in micrometers)
the Ai coefficients all have units of micrometers
p is the normalized radial coordinate defined by
where r is the radial coordinate on the surface in lens units and R is the user defined normalization radius
If your equation is already in microns, then you can just copy the coefficients into OpticStudio. I don’t know your Norm Radius and Wavelength, but I looked at your equation and found that d is roughly in the order of 1000 to 10 000 um. This means that your grating period is somewhere between 1E-3, and 1E-4 lines per um (I think the grating period is one over the grating spacing). Therefore, your diffraction angles will be quite small and hardly noticable in a 3D Layout. If I use a Norm Radius of 5.0 and use a Clear Semi-Diameter of 5.0 as well, this is what it looks at 0.55 um after 100 mm of propagation for diffraction orders +0 (blue), +1 (green), and +2 (red):
It sort of makes sense because your equation has a quadratic shape like so:
Therefore, the diffraction is closer on the optical axis because the spacing is smaller. On the edges (p = 1.0) it becomes so large that there almost isn’t any diffraction.
I tried now to insert the following series: d = 1.7e2-2.97r+2.12e-2*r^2-7.7e-5*r^3+1.56e-7 *r^4-1.86e-10 *r^5+1.29e-13*r^6-4.8e-17*r^7+7.41e-21*r^8(in mircrons red in the graph) and no matter what was the Normalziation, the grating did almost nothing.
Add here a new polynom that worked[ 3.47068643e-23 -2.42712129e-19 7.17714256e-16 -1.16904982e-12 1.14551793e-09 -6.92639738e-07 2.54963018e-04 -5.39725456e-02 6.01267046e+00]-starting with A8 and ending with A0. Now it seems to work, but I think I have now problem with our model and not with zemax. I’ll update in case I stuck again.