Solved

Polarization aberrations in Optics studio

  • 13 December 2021
  • 9 replies
  • 672 views

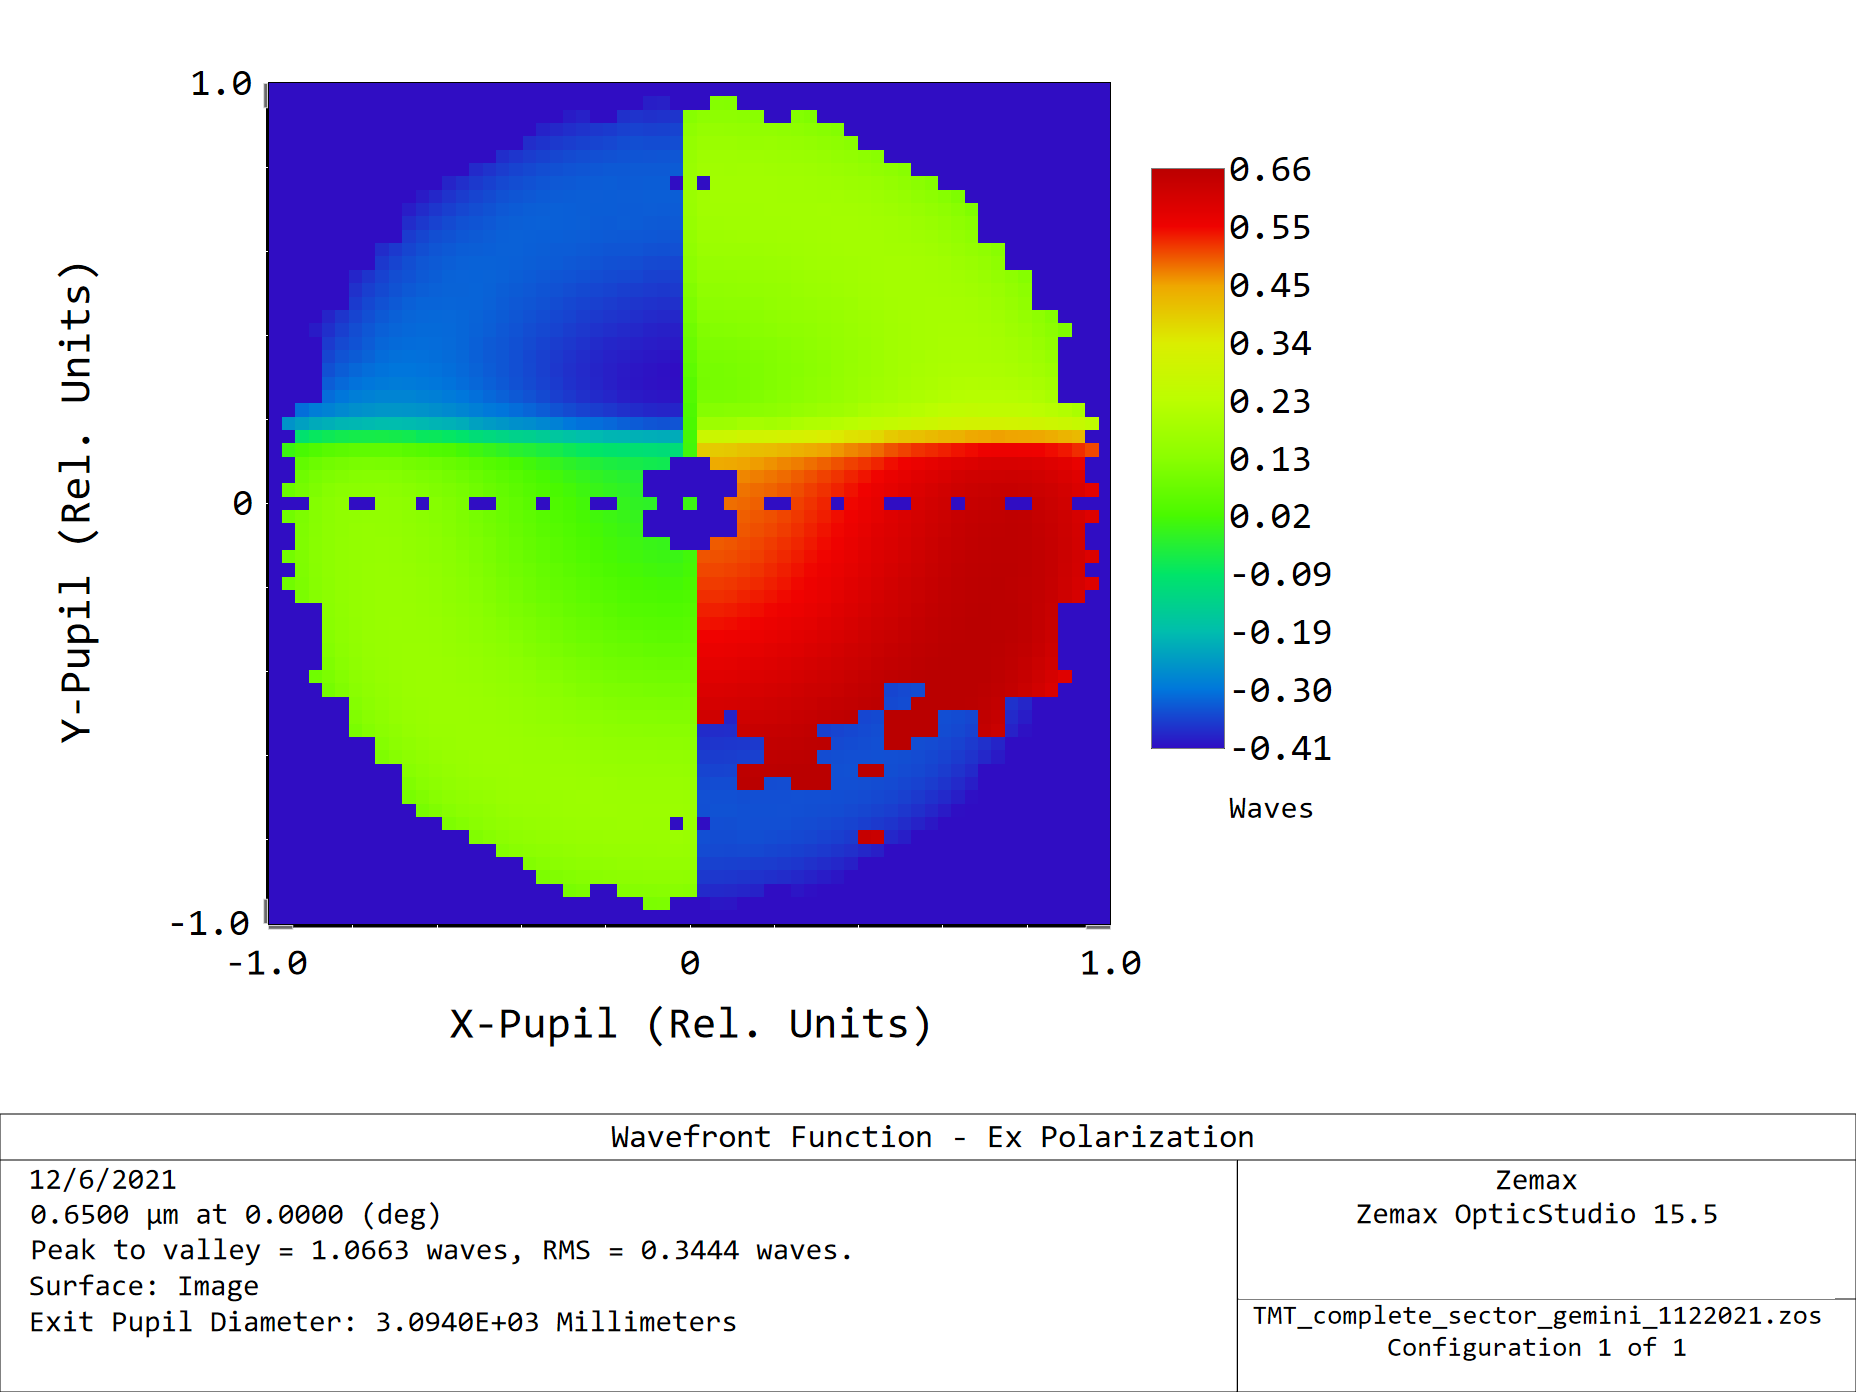
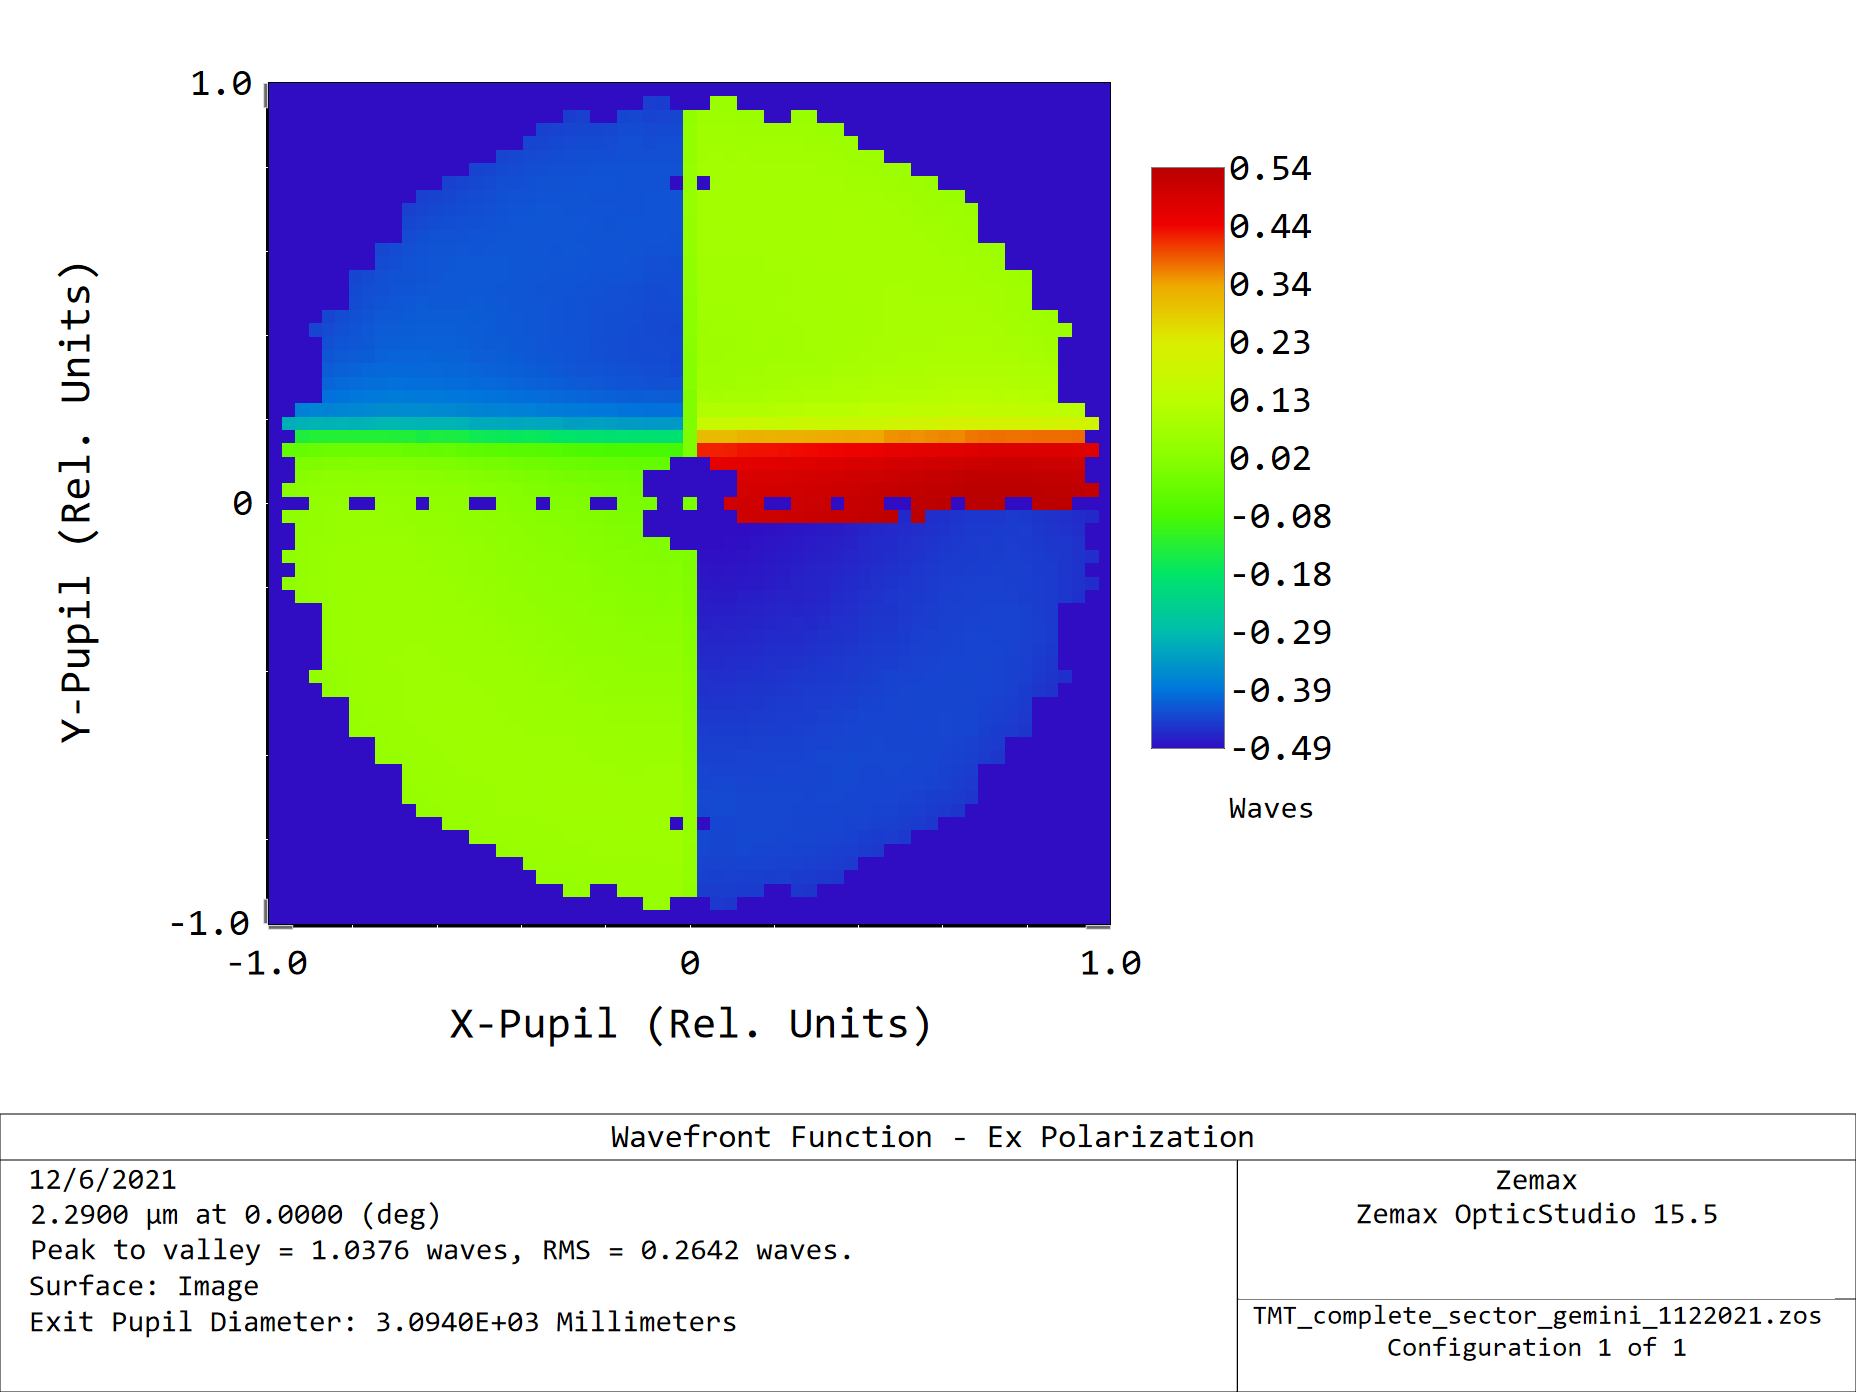
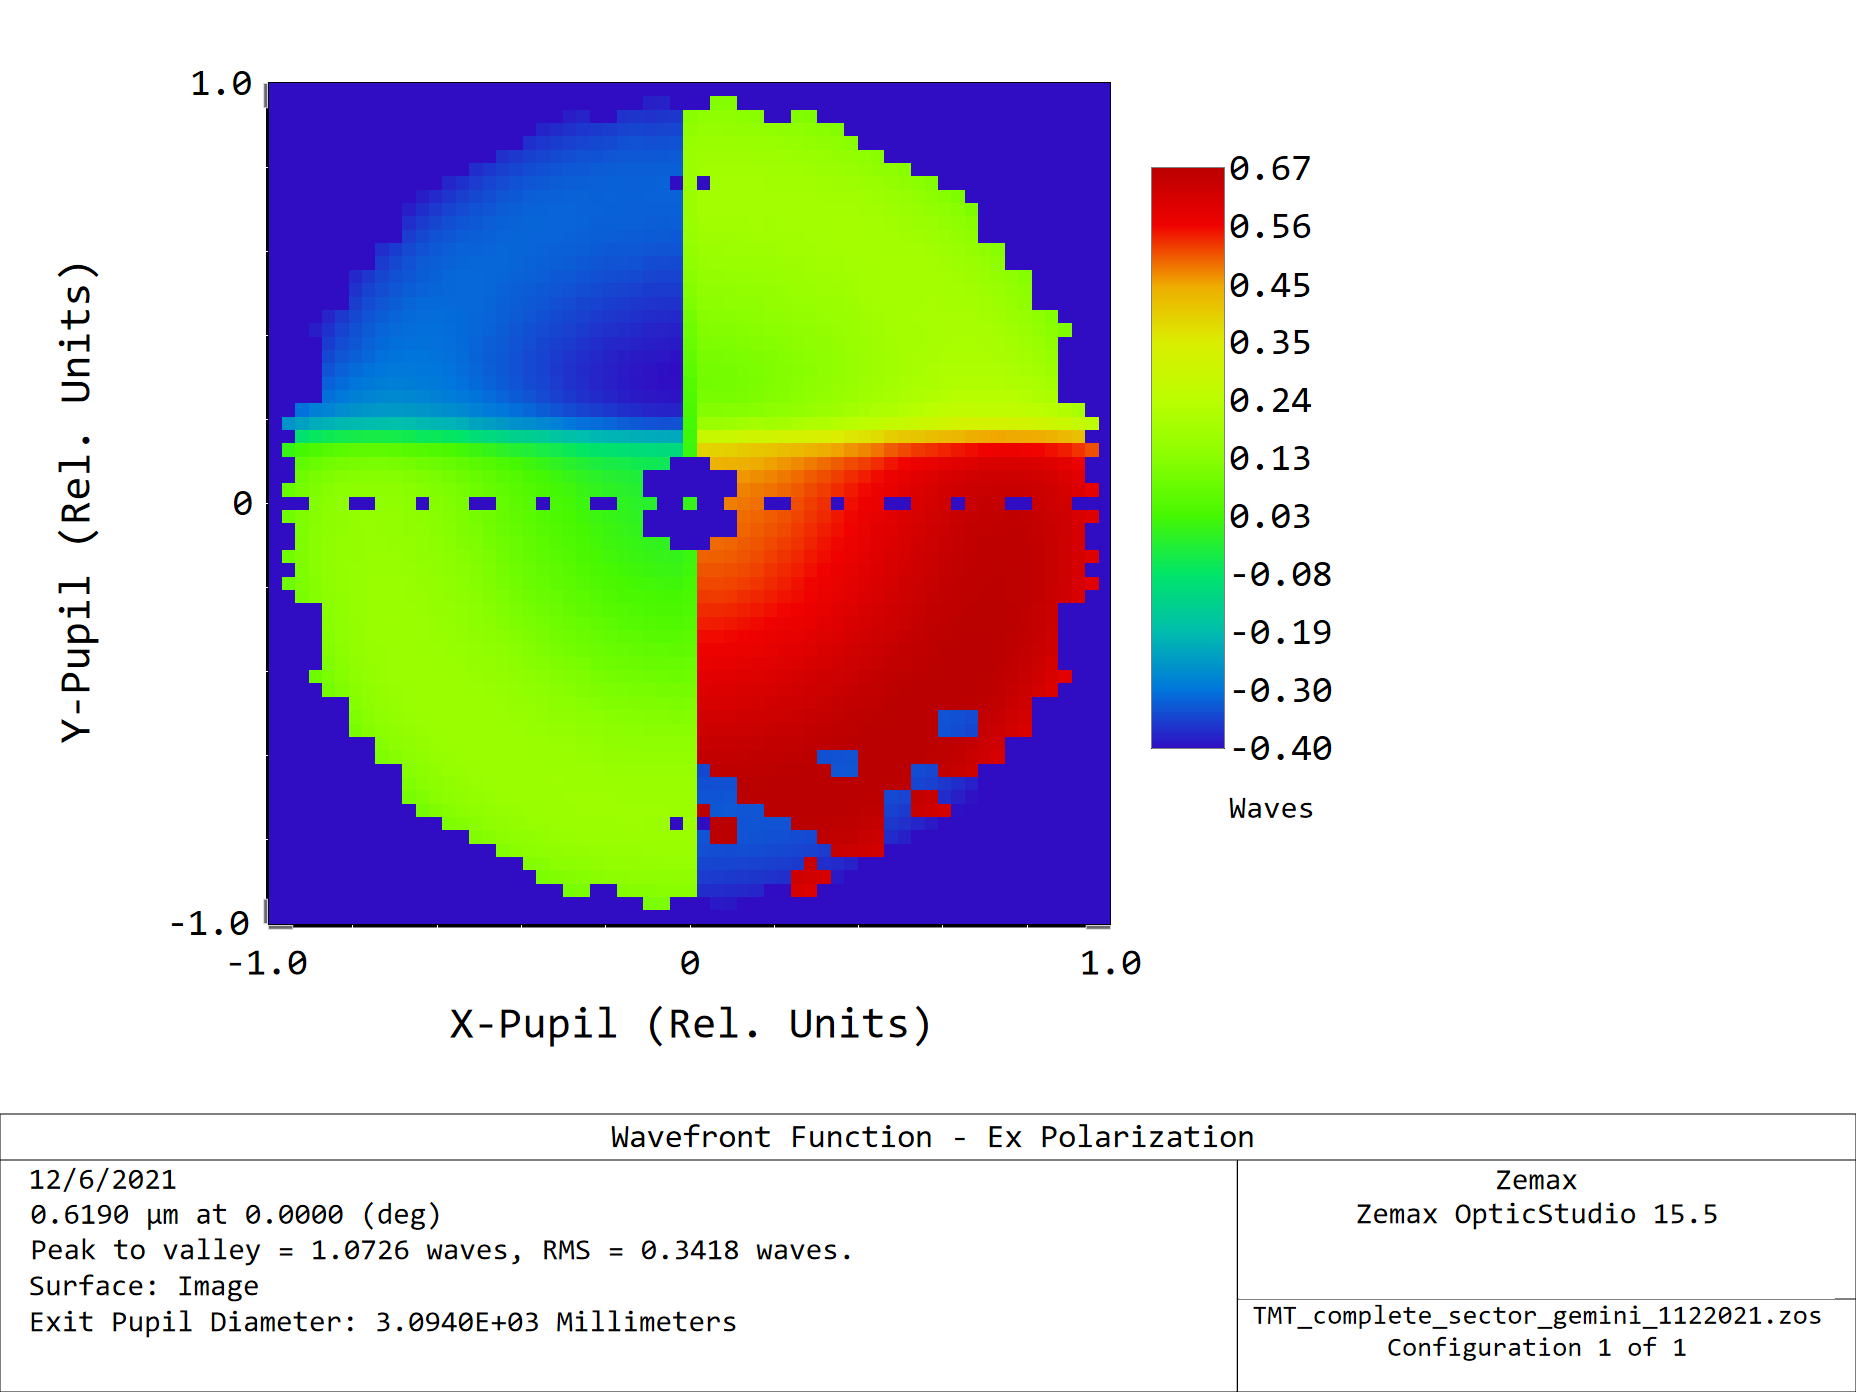
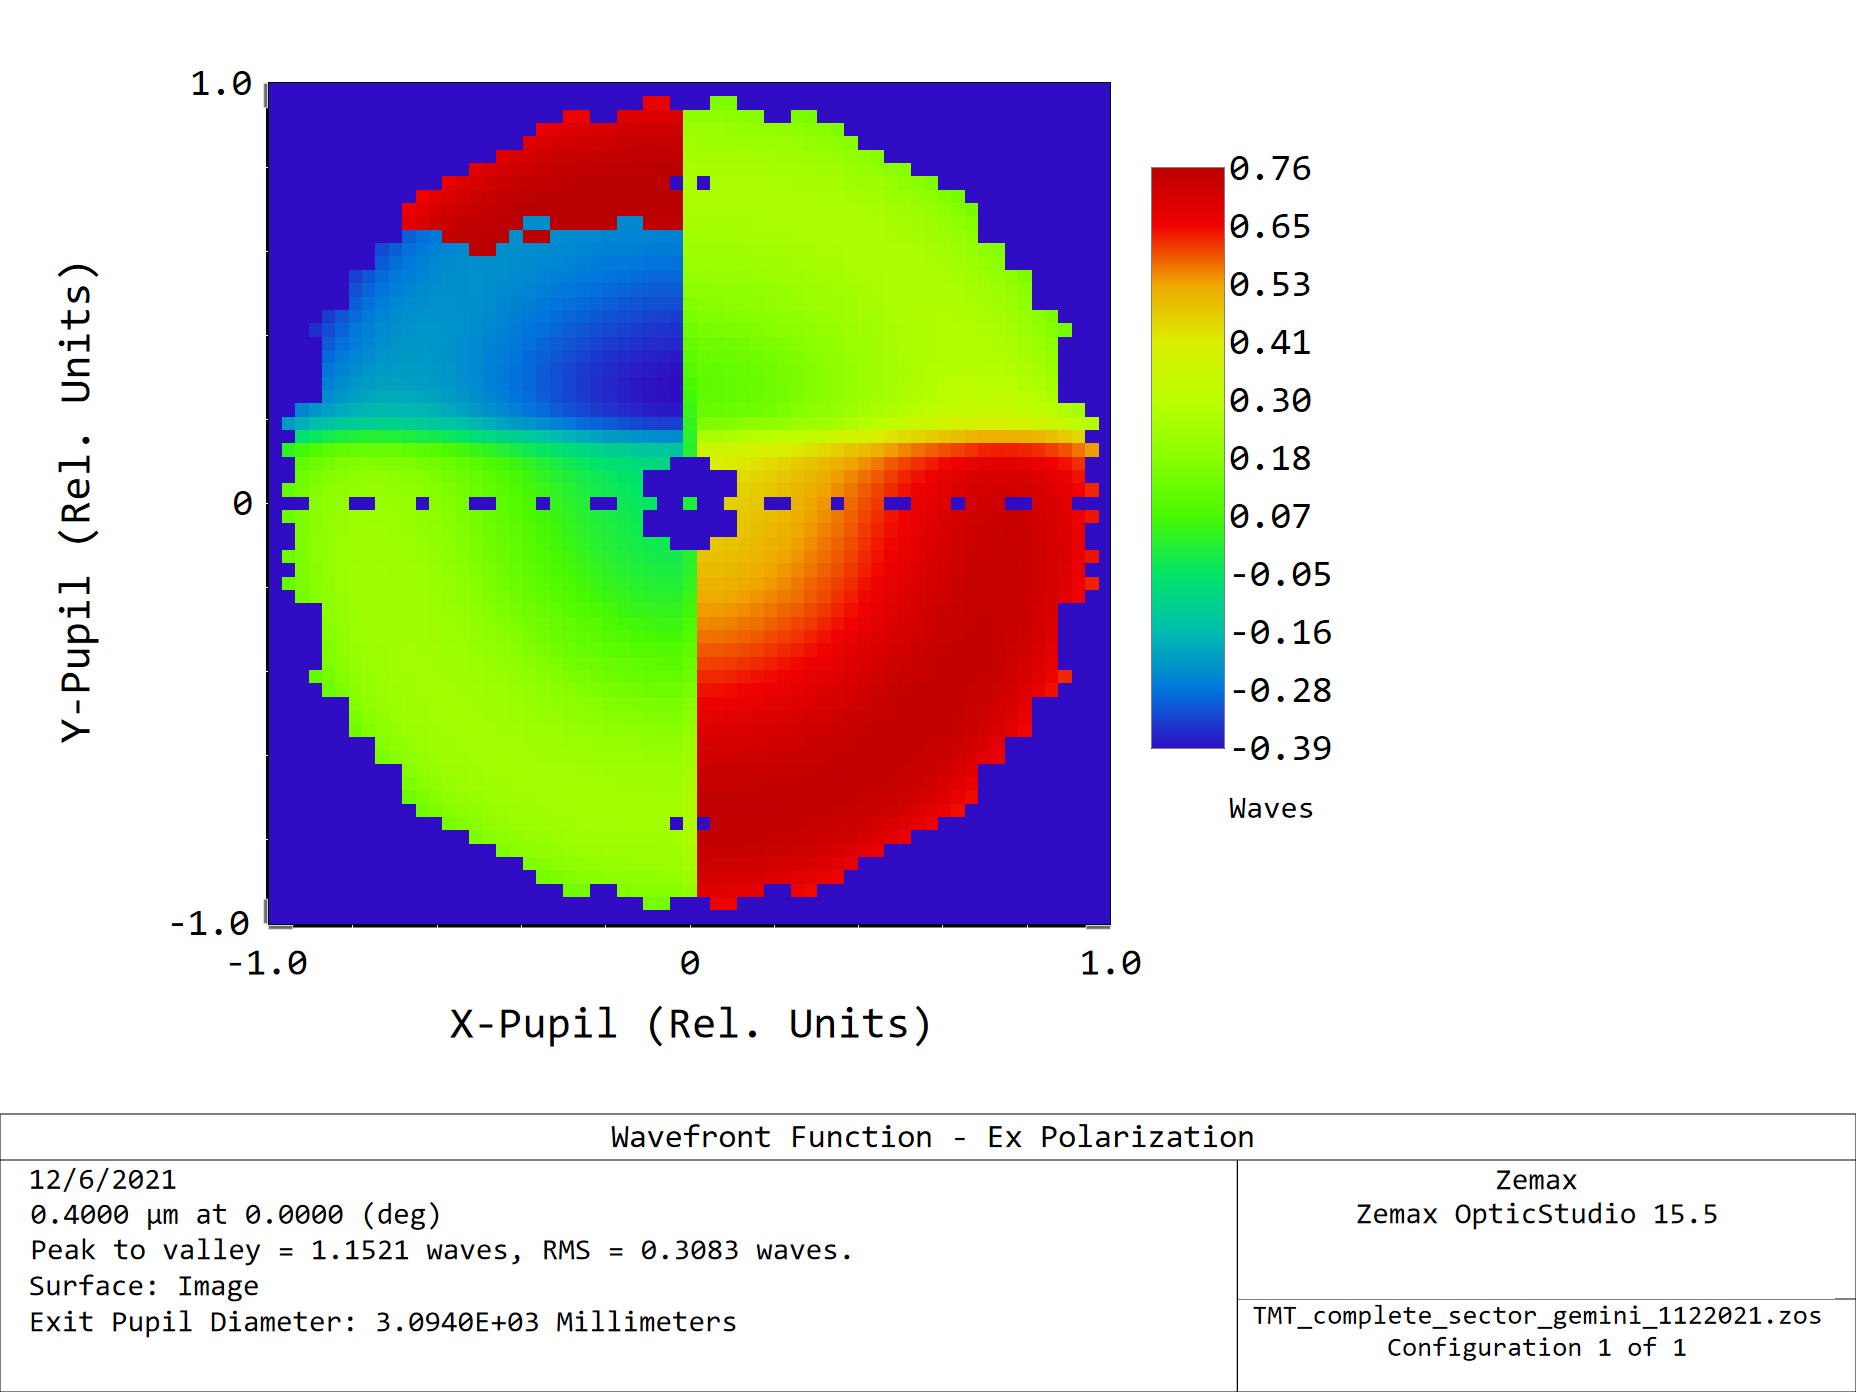
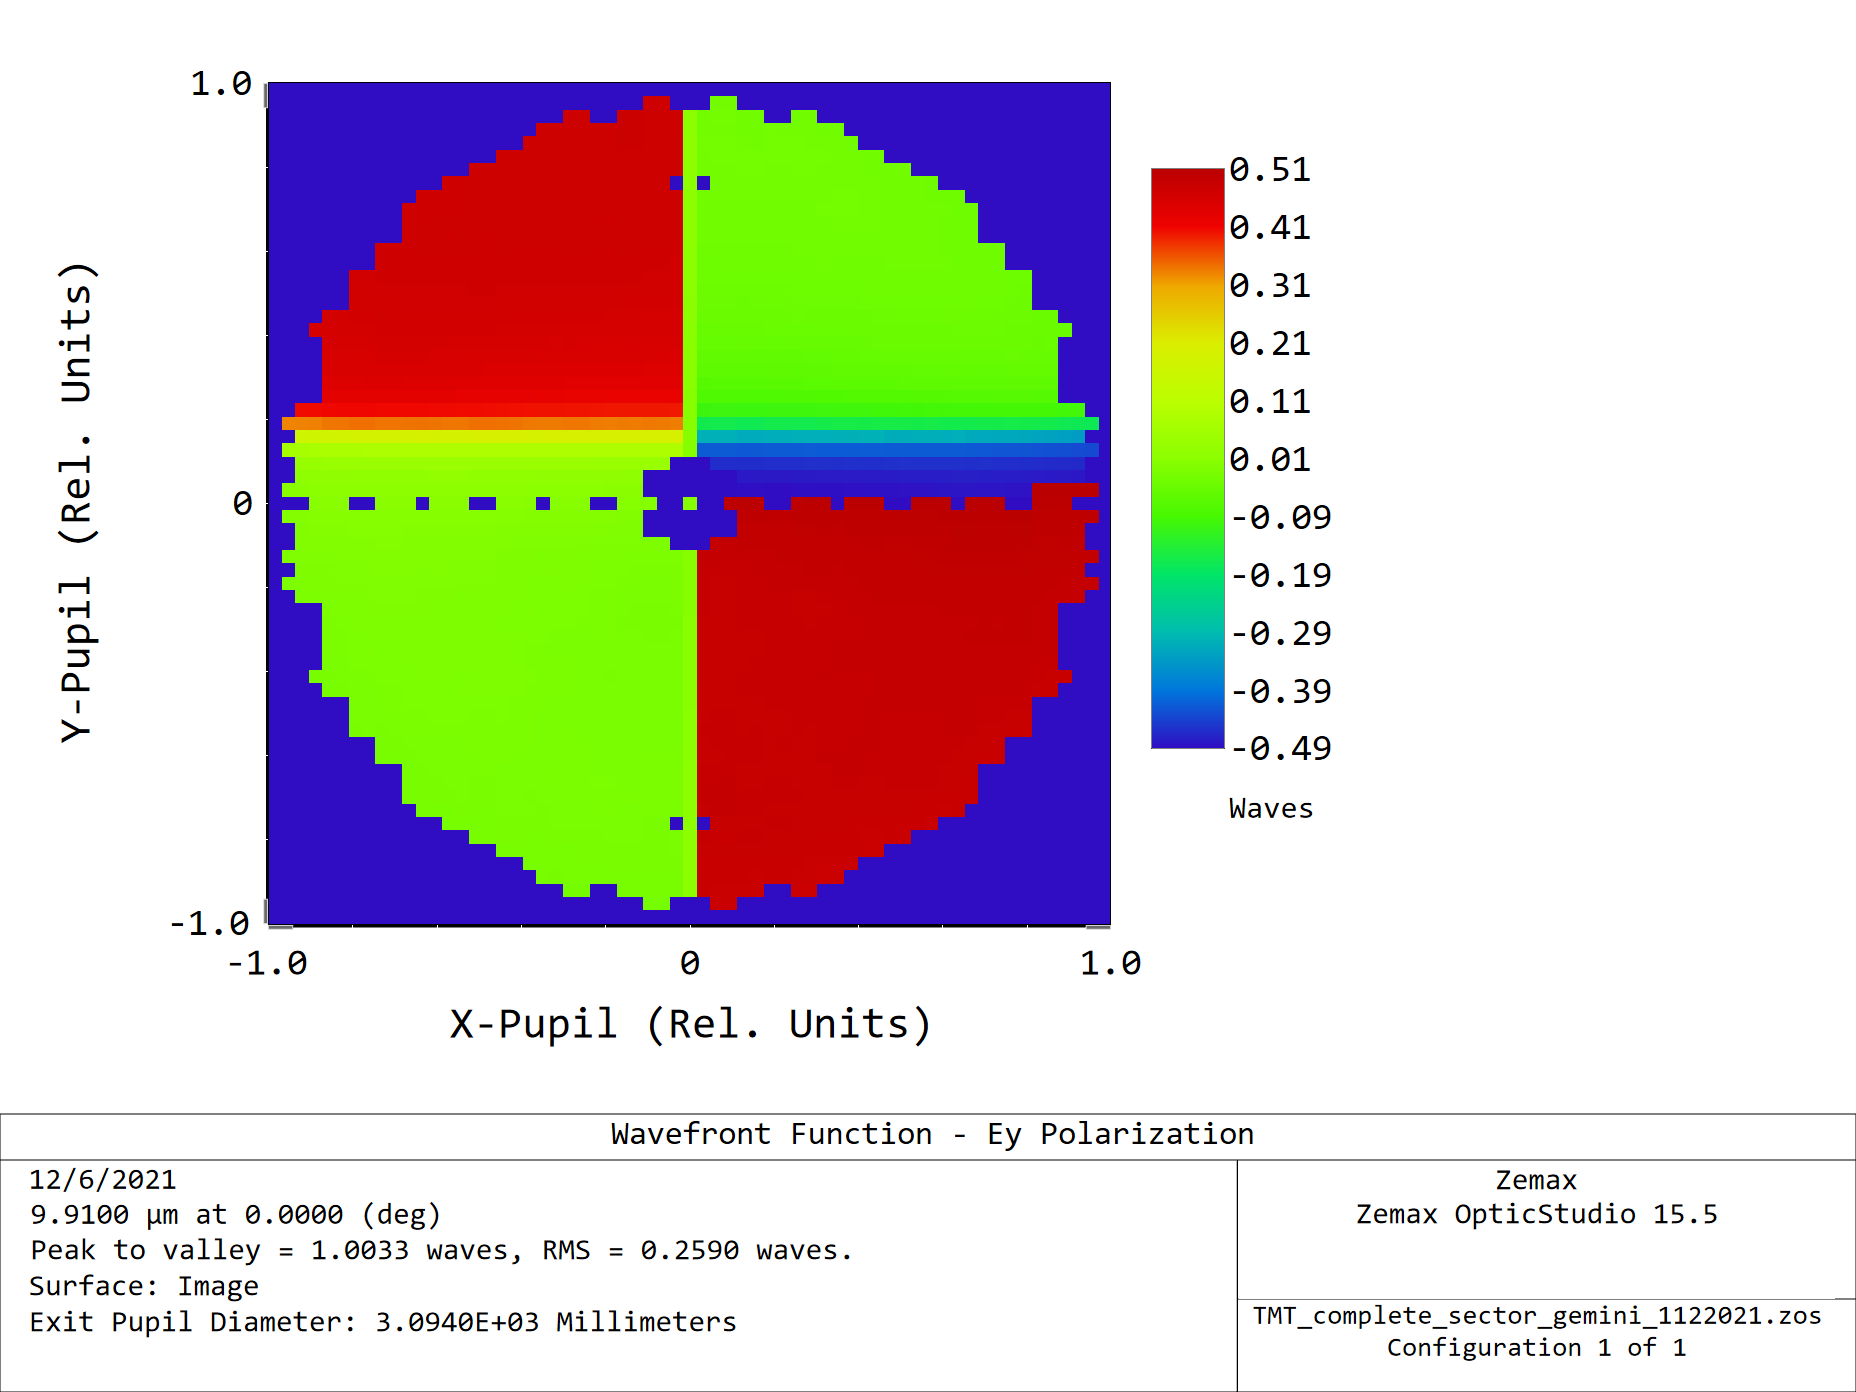
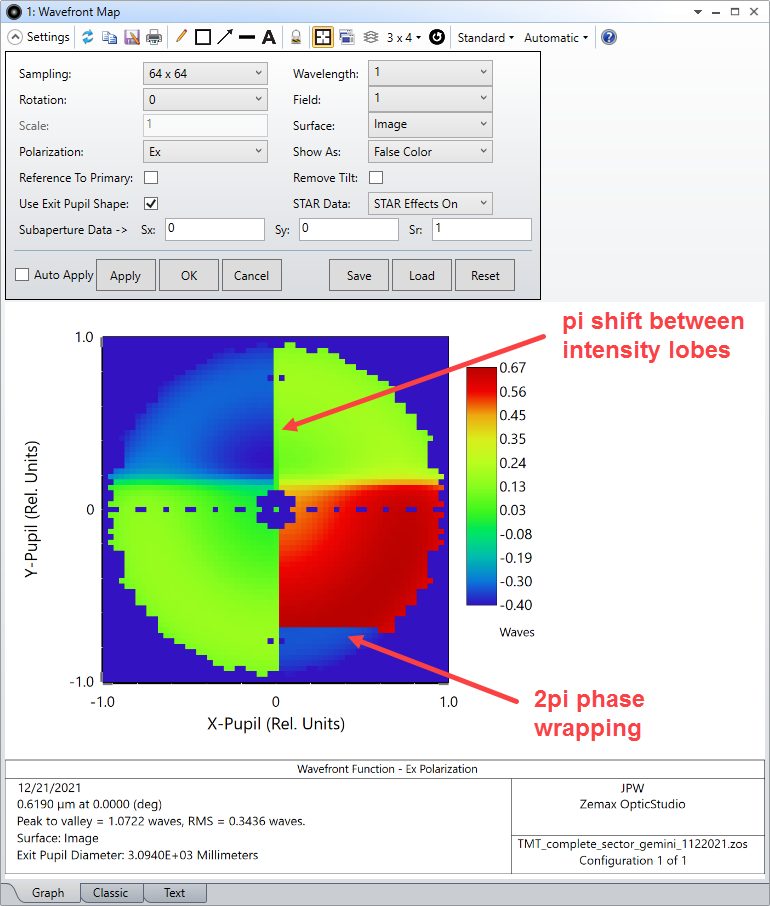
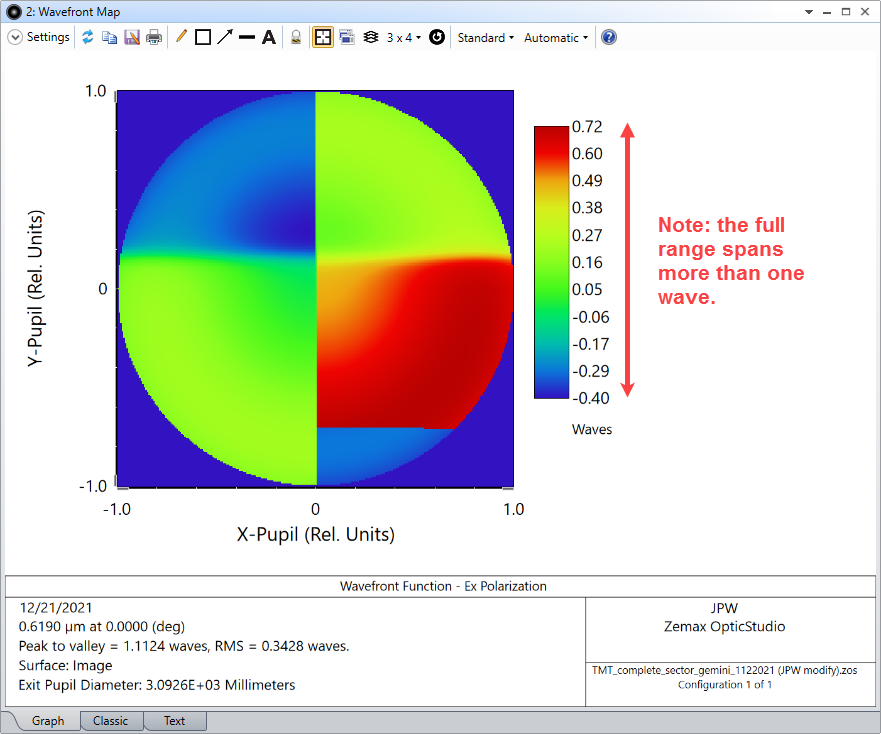
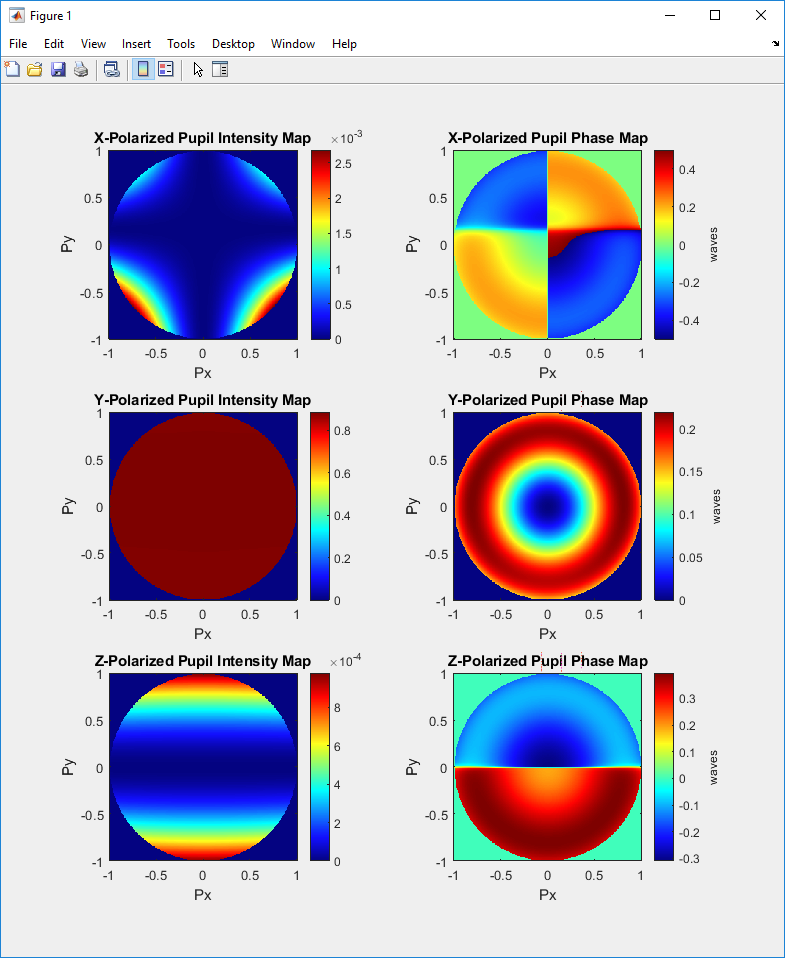
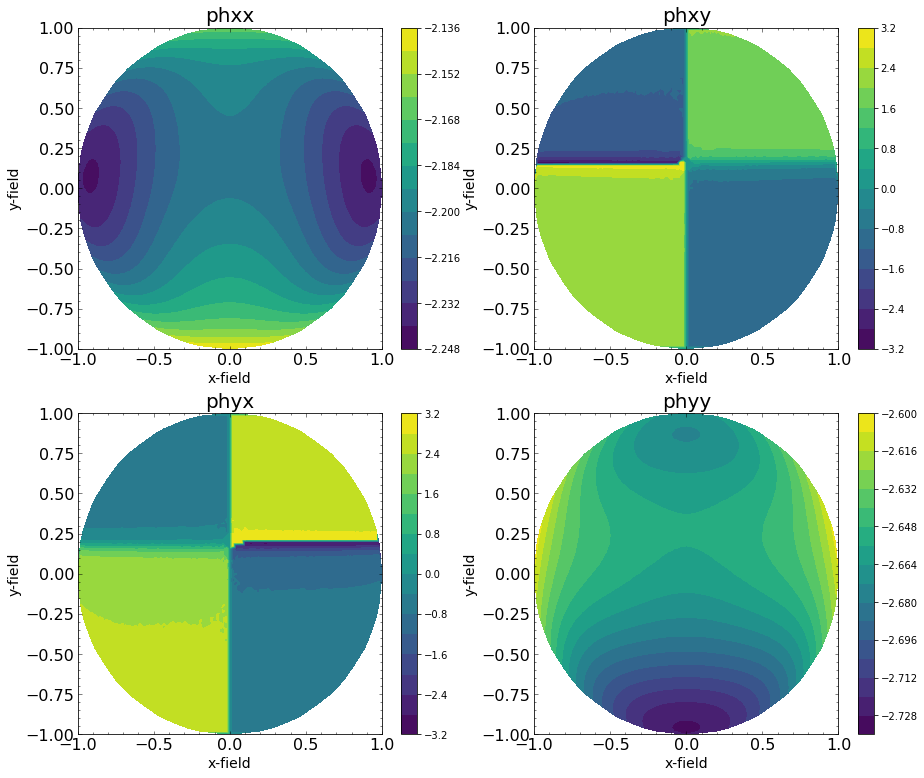
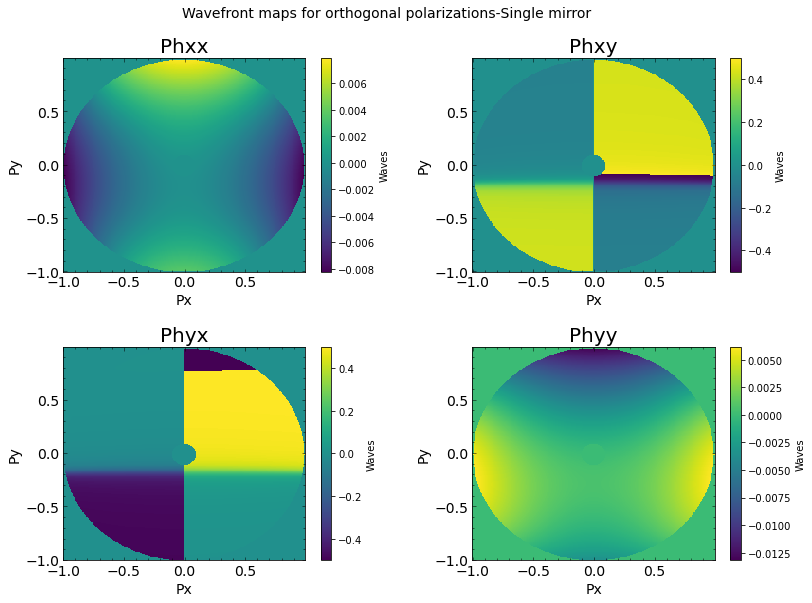
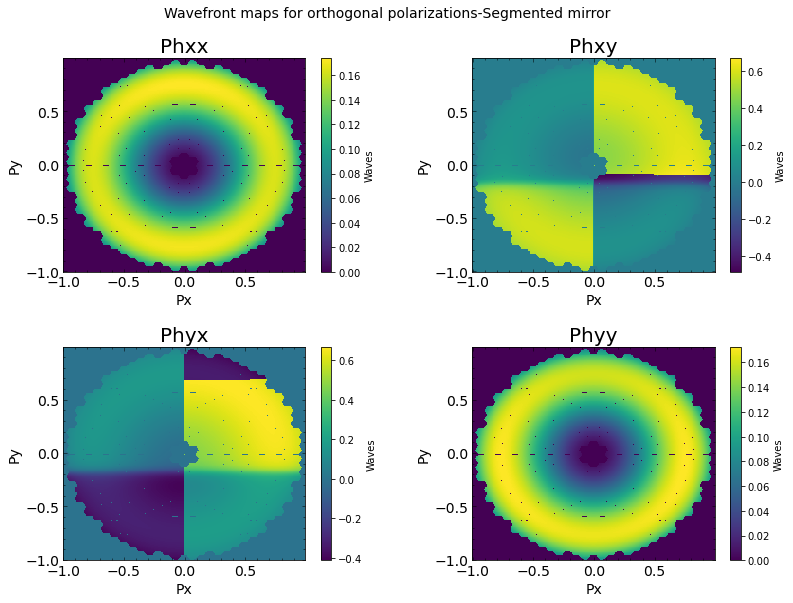
I have been trying to simulate the polarization dependent wavefront aberration in optics studio. I use the Wavefront map in optics studio considering the input polarization. I have trouble simulating the results as there appears to be a sudden discontinuity in the map which changes with wavelength parameter.  In the below figure, the lower right quadrant of the mirror is expected to have a smooth variation of the phase but there is a discontinuity without any specific reason. You can look at the maps at different wavelengths as well. Even if I  use the polarization ray trace feature, this problem persists. Does anyone know why this happens? Is this a bug in the polarization ray tracing? Does anyone know any solution to this? Thanks


icon

Best answer by Angel Morales 17 January 2022, 20:13

View original

9 replies

Userlevel 7
Badge +3

Hi Ramya,

The best I can suggest based on the plots shown is to use the polarization ray trace to trace rays across the discontinuities to see what’s happening. If that doesn’t work, please post the ZAR of your system so I can take a look.

  • Mark

Hi Mark,

Thank you for your reply. I did the polarization ray trace as well. That given random phase pattern different from the wavefront map. The phase estimated by the ray trace and the one shown in the wavefront map should be same according to my understanding. I have checked it for few of the simple cases and it matches. I am attaching the .zar file for your reference. Please let me know what you think. 

Ramya

Userlevel 7
Badge +3

Hi Ramya,

That’s quite a file you have there. :grinning: One suggestion is to use the Array object with a single Standard Surface object to form the mirror array. That will be faster to trace and render, but your file is OK, except that the marginal rays are not making it through the non-sequential group. Look at the System Check report.

Now as far as the polarization aberrations are concerned, I think this is normal. The polarization phase that is added to the optical path length is modulo-2pi and so it does show abrupt changes as the polarization phase exceeds one wave.

  • Mark

Hi Mark,

I had tried with the Array object initially but it didn’t work. I wrote a macro to create the .UDA files and put it in the non sequential editor. Can you suggest what could be changed with this configuration so that marginal rays are not missed.

Also, the strange thing I observe is, the polarization ray trace gives a different phase variation compared to the one in the wavefront map. The abrupt change happens at random locations in both the cases. 

Ramya


Userlevel 7
Badge +3

The optical path length change is a continuous function, but the phase added by a coating is module-2pi. This phase is just inverse_tan of Eimag/Ereal. It doesn’t accumulate phase, it just shows the modulo phase. However, that’s what’s important for the imaging properties of the system.

For the missing marginals, check the mirror array is large enough to capture all the rays. Then check if they are landing right on the seam between two mirrors segments. If so, rotate the whole mirror slightly so that the marginal rays land on smoothly curved surfaces/ 

Userlevel 7
Badge +3

Hi Ramya,

I took a look at your model and have a few comments to supplement what Mark has said.  

a) There is only one wavelength defined at 0.619 um. (You may want to add other values in order to span the full range of interest).

b) The coating materials should have their properties cover a broader wavelength range.  Silicon nitride goes from 0.8 - 2.0 um, and Ag is only defined at 0.619 um.

MATE SI3N4
0.800 2.00541
1.000 2.00521
1.200 2.00511
1.400 2.00505
1.600 2.00500
1.800 2.00498
2.000 2.00496

MATE AG
0.6199 0.130 -3.880

COAT GEMINI
SI3N4 0.0085 1 0
AG 0.11 1 0

In general, the coating materials should be defined over the full wavelength range of interest, unless the dispersion is negligible.

c)  It's not clear what the purpose is for using so many UDAs to define the segmented primary as a collection of nonsequential surfaces.  All segments appear to have the same coating.  That being said, I'm using the latest version of OpticStudio (21.3.2) and don't see the same "randomness" that you show in your wavefront maps.  I simply opened your file, and this is what I get for Ex polarization at 0.619 um (source having Jx=0 and Jy=1):

There are two types of abrupt phase changes present, namely: (1) pi shifts between different quadrants of the beam (corresponding to transitions between intensity lobes as shown below), and (2) 2pi phase wrapping transitions (which are not discontinuities).  

d) For detailed polarization analysis, I would suggest you start with a simpler model, for example one with a continuous primary mirror defined in a fully sequential model.  

In this case, here is the Ex wavefront phase map at 256 x 256 resolution:

The phase transitions are more clearly defined now.  Also, it appears that OpticStudio has a way of computing the phase maps such that the full range of the color scale spans more than one wave.  

e) To explore some of the detail further, I wrote a ZOS-API Matlab script to use polarization ray tracing to re-create the wavefront phase maps as well as to generate corresponding pupil intensity maps.  For the simpler version of  your model (i.e., the non-segmented primary mirror), this is what I obtain for all three polarization components:


These pupil maps are found by extending ray tracing from the image plane to the exit pupil reference sphere.  A few key things to note here.  First, the intensity profile for the Ex polarization is very weak, almost three orders of magnitude less than the dominant Ey component.  Nonetheless, the pi phase transitions for the Ex component occur in regions where the intensity goes to zero.  The same applies to the Ez component.  So these pi transitions are not physical discontinuities (similar behavior occurs for guided-wave and laser modes, e.g., Laguerre-Gaussian modes).  Second, I'm computing phase in Matlab as atan2(Eimag/Ereal), which is the four-quadrant version of arctangent.  This appears to be the same way that OpticStudio finds the phase as reported in the polarization ray tracing analysis output.  As a result, my phase maps are always constrained to have a maximum full scale of (-pi,pi), or (-0.5,0.5) in waves -- this in turn means my phase plots display phase wrapping in different locations compared to the OpticStudio versions.  Not sure how OpticStudio goes about computing phase maps with a broader full scale.  Lastly, OpticStudio applies a phase offset to each of the wavefront phase maps (compared to maps found directly from polarization ray tracing).  This is likely done for improved visualization purposes.  In my plots I’ve replicated the same offsets.  So, each individual phase map has correct relative values, but you probably shouldn't use values in one map along with those in another map to do any sort of quantitative polarization analysis as the maps may have different phase offsets.  

Hope this helps.

Jeff


Hi Mark and Jeff,


Thank you for the detailed suggestions and solutions. I understood the phase unwrapping to be done for the cases where it is more than one wave. I have been using “Poltrace” feature in Zemax to simulate the polarization dependent wavefront aberrations. My aim is to simulate the polarization aberration for a segmented mirror telescope system. (The one in the design file). I have the following results/issues when I run my simulation.

  1. I obtain the output Ex and Ey electric fields for two different inputs. Jx=1, Jy=0 and Jx=0 and Jy=1. Below I show the plots for the amplitudes and phases obtained using the “Poltrace” function for a telescope with the single mirror.(As Jeff suggested)

    I then compare these with the wavefront maps for the two input polarizations : As shown below,

    Comparing the phase maps obtained in both the cases: All the four phase components look similar although there is some rotation. There is no need for phase unwrapping for polarization aberrations obtained using “Poltrace” since it gives the actual phase of the electric field vector.

  2. Now, I repeat the same simulation for the segmented mirror telescope. The only difference between the single mirror and segmented system is the segmented mirror system is designed using mixed-mode with non sequential components. The following results are obtained:

    Here the phase obtained by Poltrace is random for all the components using Poltrace where as, the wavefront map for the orthogonal polarizations shows:

    This Wavefront map looks similar to the one obtained in the single mirror case (At least for the Phxy and Phyx components). 

This brings me to the actual question, Does Poltrace work for the mixed-mode in Optical studio? If it does, then how does it simulate different polarization phase aberrations for the “Poltrace” and Wavefront map function?

Please let me know if you have solutions/suggestions to debug this issue.

Userlevel 7
Badge +3

Thanks Ramya for these additional results.  It’s indeed strange that POLTRACE in ZPL doesn’t seem to work properly for your mixed-mode layout.  I also have a similar problem when using the IRayTraceNormPolData interface in ZOS-API (for just the mixed-mode model, the fully sequential model behaves properly).  It would be good to have Zemax tech support take a look.

Userlevel 5
Badge +1

Hi all,

Thanks for your posts and discussion here on the forums. Jeff reached out to directly to Zemax Support on this topic, so I thought I would update this thread based on the details in that support ticket.

It looks like this is likely a bug related to how the phase of the ray is tracked once it enters the NSC Group. I think the expected result should be that we get similar results between Polarization Ray Trace (which is what POLTRACE/IRayTraceNormPolData uses) and the Wavefront Map results. I have already logged this internally for our Development Team to take a closer look. Thanks for your understanding here.

In the meantime, it looks like the best way to refer to your results will be either specifically in the Wavefront Map output or to use POLTRACE in a purely Sequential Mode system.

Let us know if you have any more questions, and we’ll be happy to discuss further. Thanks!

Reply