
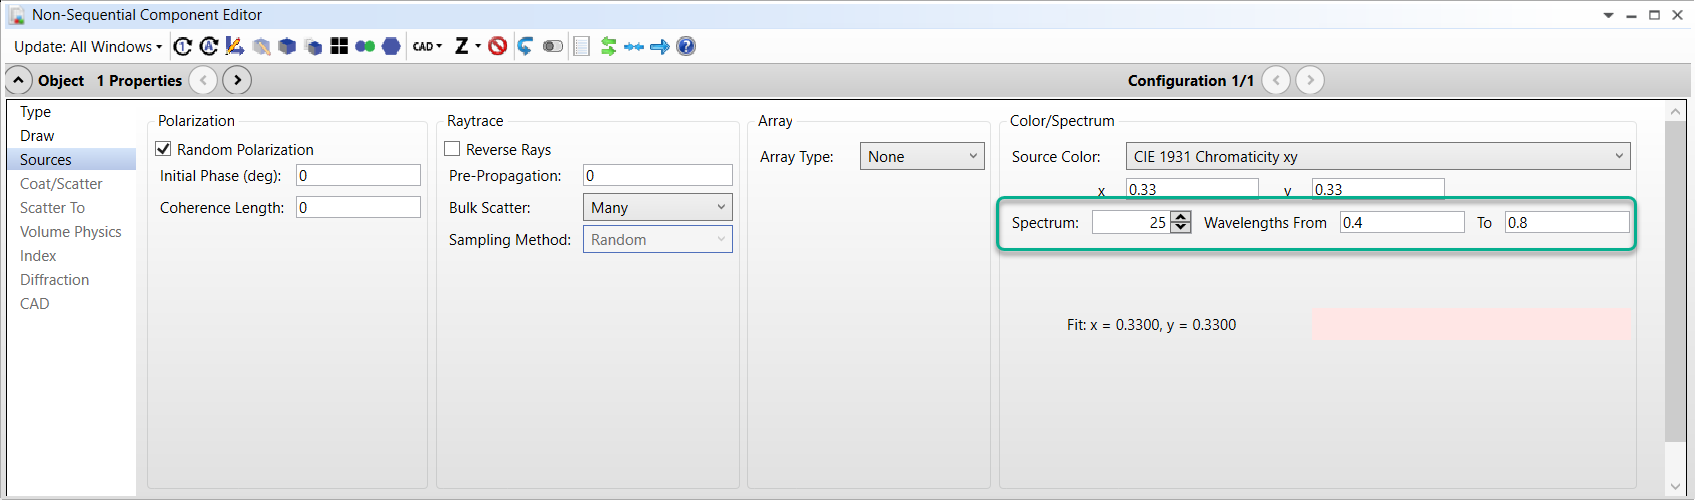
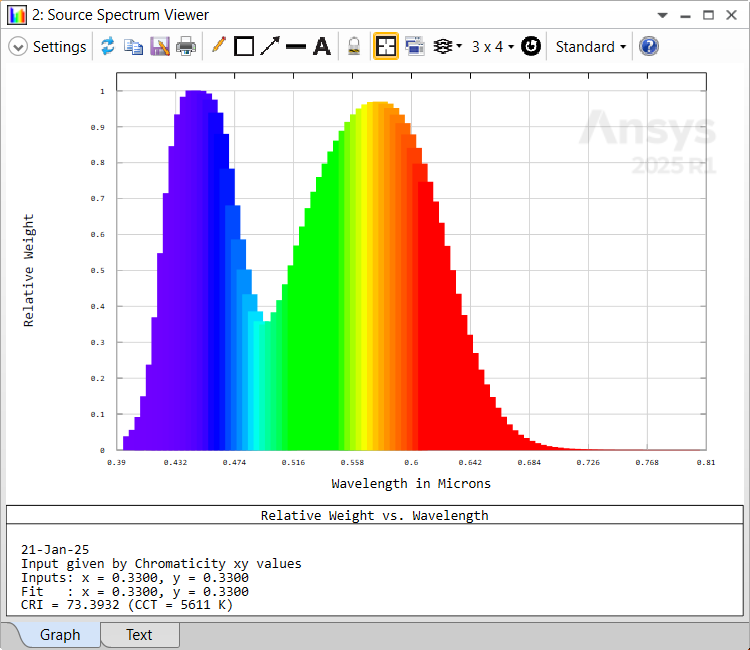
Hi everyone, I'm having difficulty understanding how I can reproduce the emission spectrum by providing only xy CIE1931.

I would like to compile an Excel file or an Octave routine that simulates this calculation.

Sometimes white LED suppliers do not provide SPDs but only CIE1931 coordinates.

Thanks so much everyone.

Dear Luca,
Indeed, x/y coordinates do not fully describe a spectrum.
This is why, when you are using the chromaticity xy option in OpticStudio, you need to enter additional information about the spectrum (number of wavelength, range)

OpticStudio will then compute the spectrum accordingly, that matches the x,y color coordinates.
You can find additional information in the help files: The spectrum fitting algorithm
You can also use the Source Spectrum viewer to visualize the computed spectrum, for instance:
 

I hope this helps!


Reply