in order to assess a long distance propagation of a collimated laser beam in dependence of the quality of the optical system, I have used a POP propagation through my optical system (several spherical and aspherical lenses with a SMF source). I have turned my system to an afocal system.
Having the tolerances of my lenses, I perform a tolerance analysis with 20 Monte-Carlo runs. My only compensator is the distance between the SMF fiber and the first lens collimating this beam (with the NA of the fiber).
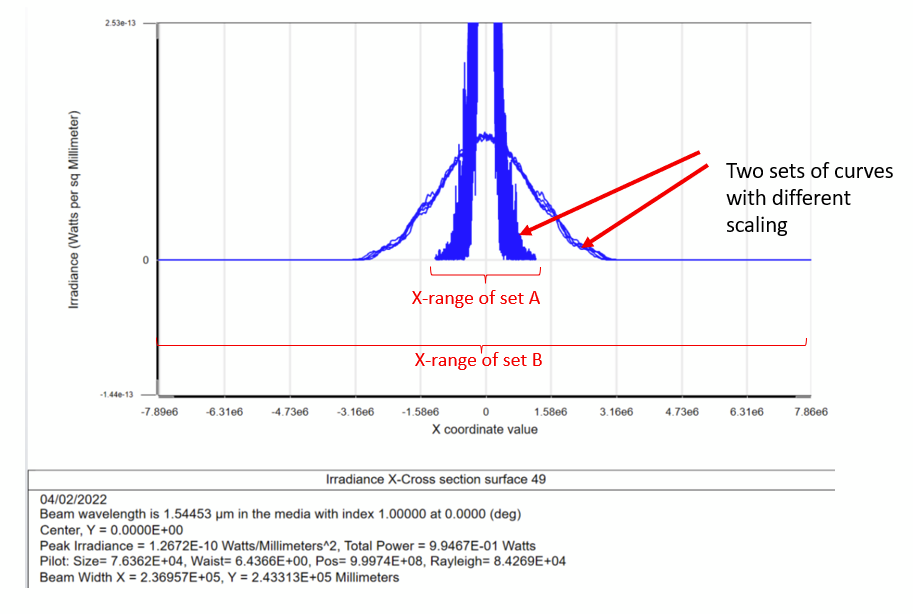
Here the output of the POP cross-section overlay graph:
What I find interesting is that there are two distinct sets (set A and B) of curves. These sets seem to have a different scaling, as they have different x-ranges (ranges A and B).
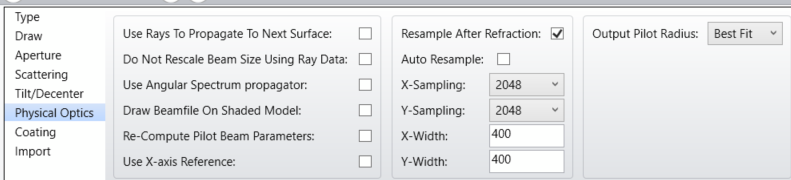
I can’t imagine that there is an automatic rescaling. I have turned any “Re-Compute Pilot Beam Parameters” off, and also the “auto resample” (which probably would not do a resample during the different runs, would they?).
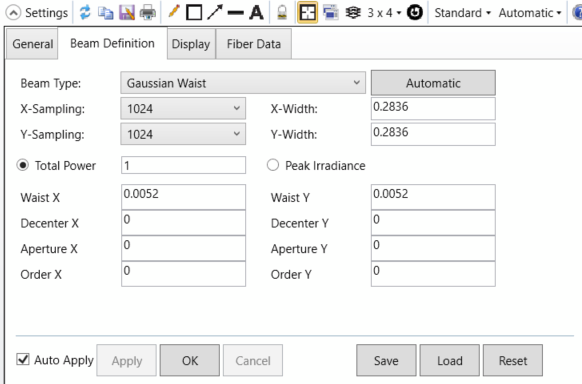
This is the only resample I do in the system.
Where could these two ranges come from? This is an essential question for me, as I want to assess the beam width and the peak power at the long distance.
Many thanks for a good advice!
Markus
Best answer by Sandrine Auriol
Hi Markus
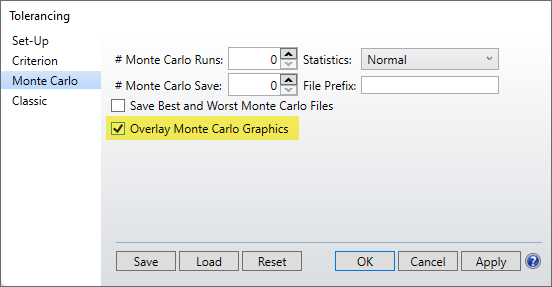
Did you tick “Overlay Monte Carlo Graphics” when you did the overlay? That function can change the scaling of the plot when it overlays. So I suppose one way to do it is to fix the scale before running the tolerancing.
This can be done by changing the X and Y scale to manual. I haven’t tested it but this is what we do on other analyses.
But in your screenshot it seems that the beam at the image plane has a fixed sampling. Is it at the image plane?
If not this is something you could do, fix the sampling at the image plane with these settings.
The scale of a result in POP can change because of the algorithm chosen by the pilot beam to propagate the real beam. Basically the beam size is fixed within the Rayleigh length but increases linearly when outside of the Rayleigh length.
The option “Do Not Rescale Beam Size Using Ray Data” (as I understand it) is linked to the beam going from before a surface to after a surface. The software calculates a transfer function and evaluates if the beam needs to be stretched in one direction.
Let us know if that helps and if you are happy to share your file as support@zemax.com, we can have a look at it for you. And of course let us know if I misunderstood any of your comments.
Dear experts, could this varying scaling of the matrices be caused by an automatic rescaling at the surfaces in the system to keep a good resolution of the spots, which could vary between the different Tolerancing Monte-Carlo runs, as the irradiation distributions will look different between the runs?
Can I suppress this by ticking “Do not rescale beam size using ray data”?
Did you tick “Overlay Monte Carlo Graphics” when you did the overlay? That function can change the scaling of the plot when it overlays. So I suppose one way to do it is to fix the scale before running the tolerancing.
This can be done by changing the X and Y scale to manual. I haven’t tested it but this is what we do on other analyses.
But in your screenshot it seems that the beam at the image plane has a fixed sampling. Is it at the image plane?
If not this is something you could do, fix the sampling at the image plane with these settings.
The scale of a result in POP can change because of the algorithm chosen by the pilot beam to propagate the real beam. Basically the beam size is fixed within the Rayleigh length but increases linearly when outside of the Rayleigh length.
The option “Do Not Rescale Beam Size Using Ray Data” (as I understand it) is linked to the beam going from before a surface to after a surface. The software calculates a transfer function and evaluates if the beam needs to be stretched in one direction.
Let us know if that helps and if you are happy to share your file as support@zemax.com, we can have a look at it for you. And of course let us know if I misunderstood any of your comments.
thank you for your effort and the hints. Indeed I ticked the Overlay Monte-Carlo Graphics option in the tolerancing GUI. Very helpful feature.
Fixing the scaling of the axes seems to have helped. I am still optimizing the POP parameters, so I will further investigate. I will also keep an eye on the automatic resampling feature of the POP, potentially manually fixing it down.