Question

MTF and Spot Diagram don't agree


danr1
  • Single Emitter
  • 4 replies

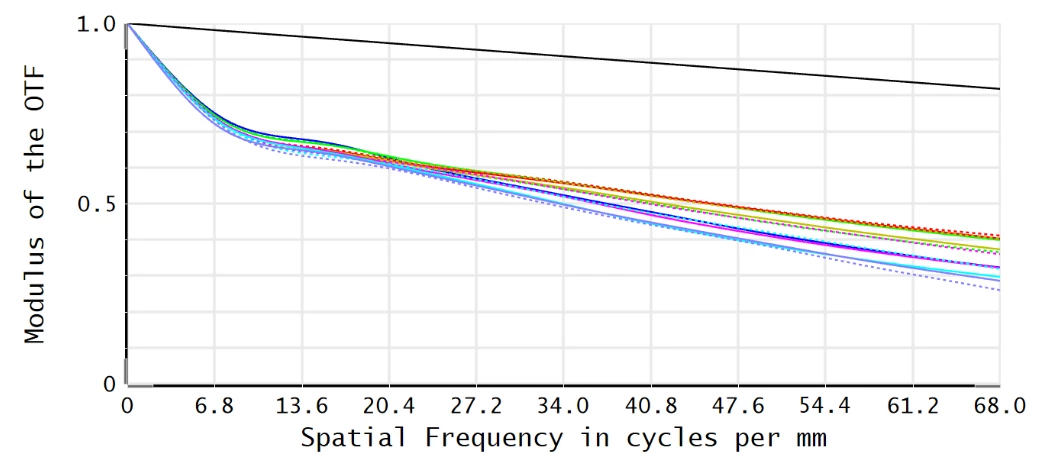
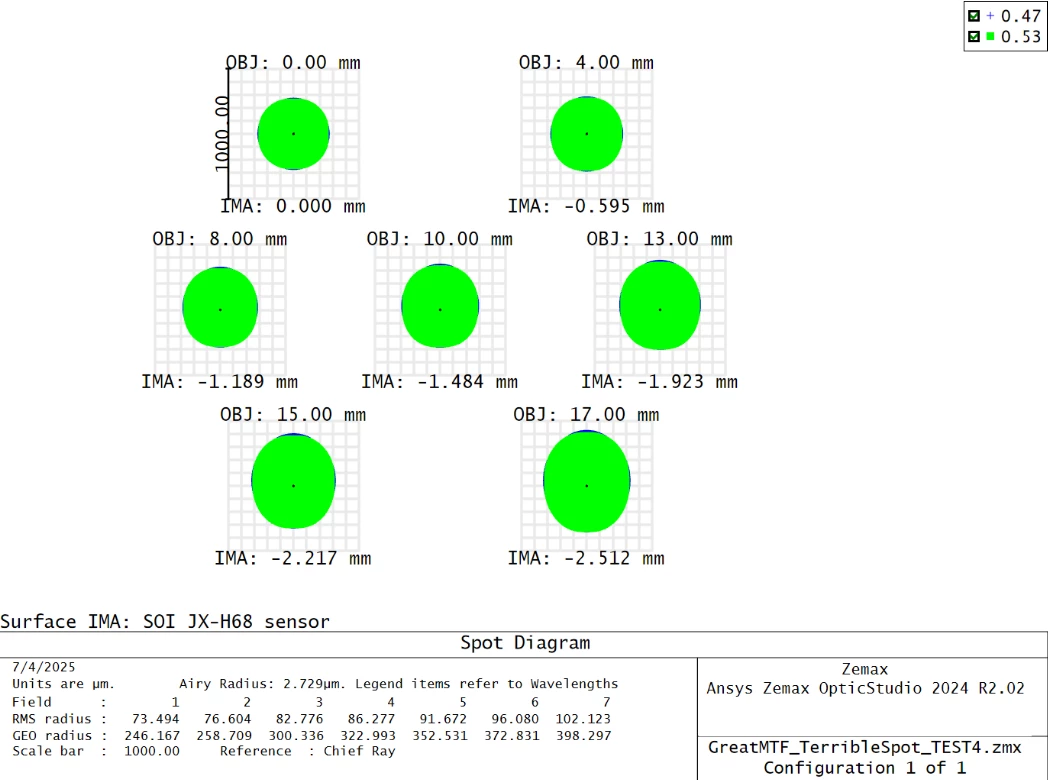
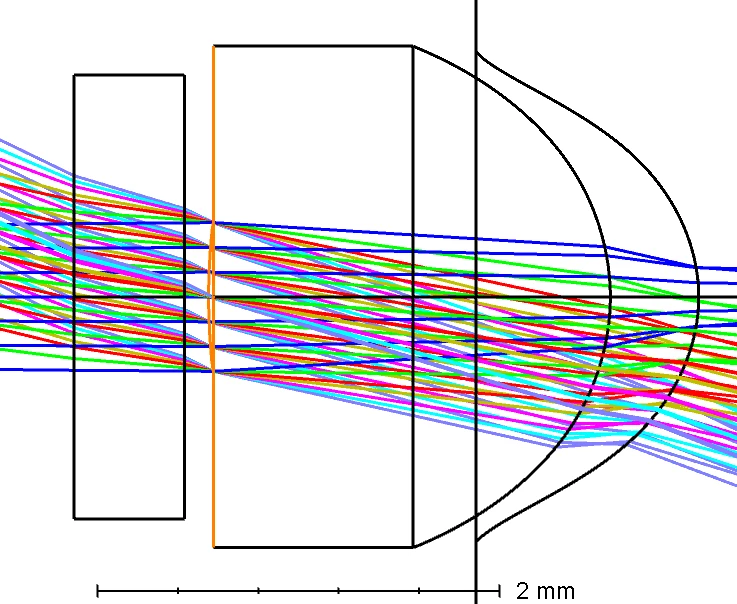
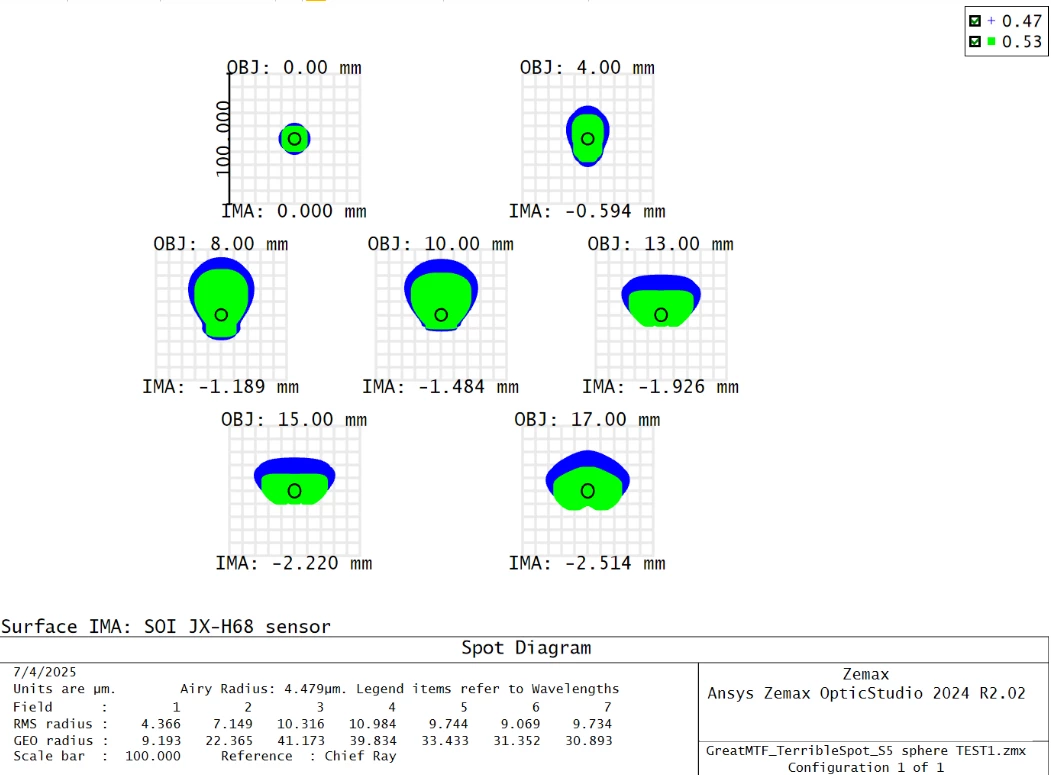
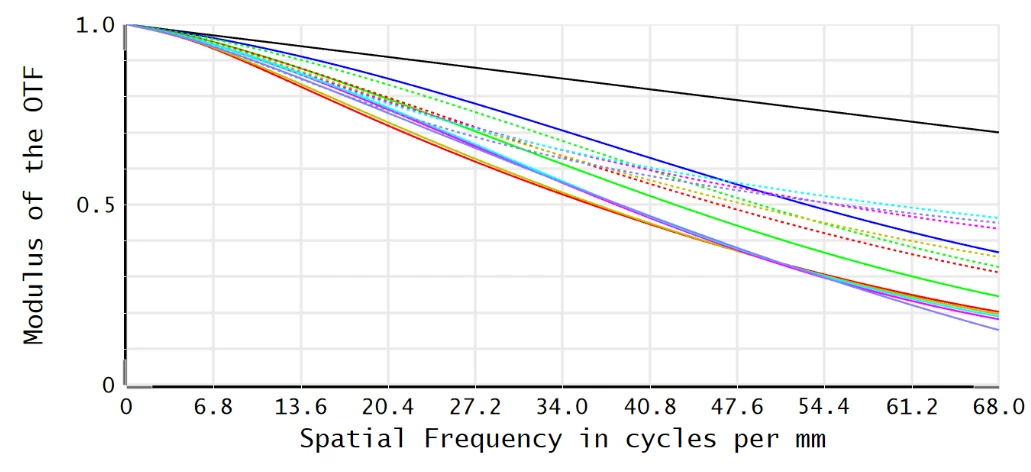
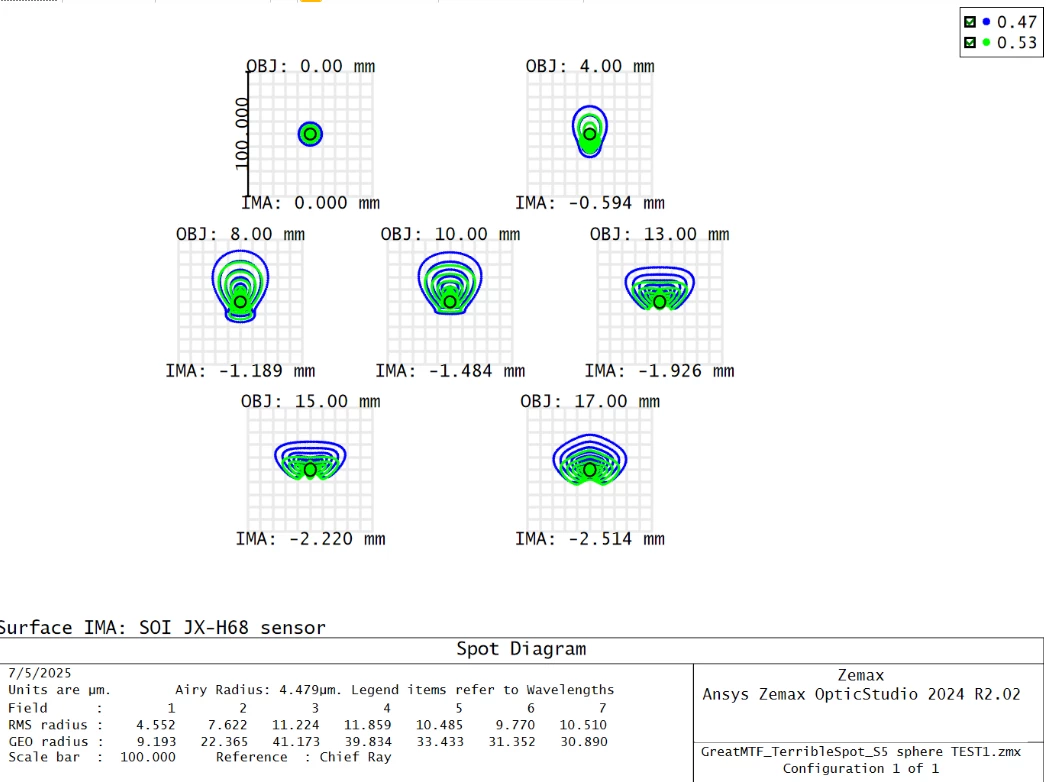
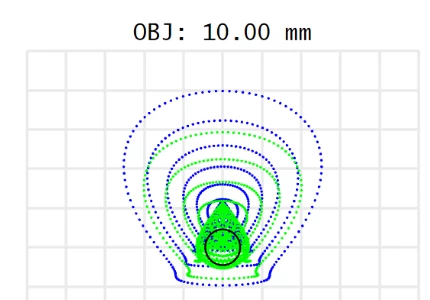
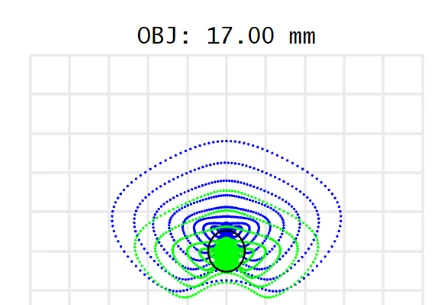
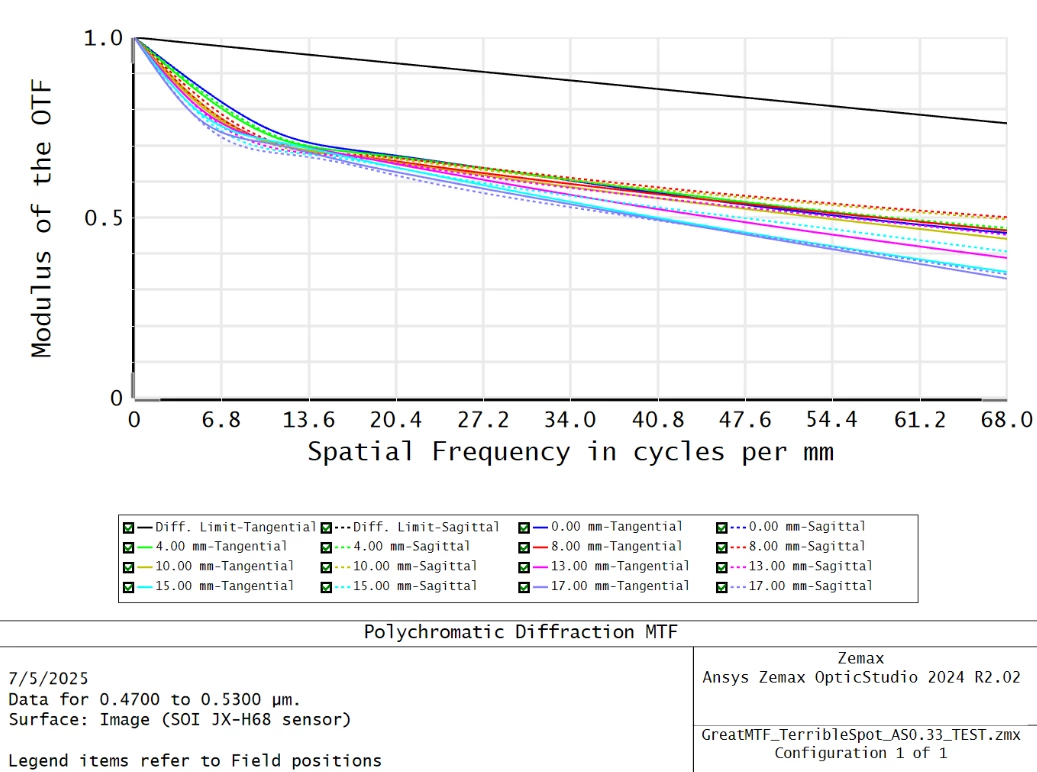
I used global optimization on a 2-lens imaging system with each lens having dual even asphere surface.  The merit function improved a lot but now the diffraction MTF seems too good compared to how the rays look focusing in the 3D layout and how they look in the spot diagram.  The only thing I can think is that since I have rather steep slopes to my lenses (due some high conic constants and one surface have high r^8 coefficient) that maybe there is some sampling issue.  I did increase the ray density for the spot diagram and it does improve, but I am still concerned about the accuracy of the results I am getting.  Any advice would be helpful -- Dan

8 replies

Forum|alt.badge.img
  • Fully Spectral
  • 109 replies
  • July 4, 2025

Hi Dan,

Have you checked with geometric MTF ? Not that is is more accurate than diffraction MTF, but I would expect it to correlate more with spot size.

As you noticed in your tests, the sampling of 6 is too coarse for your spot, which seems to have a wide foot. 100 is perhaps too much, but 6 is clearly too low (in general, if you have aspheres, you want increased sampling).

You could also play with sampling on the MTF side.

In theory, if you have a very fine peak and a very wide weak foot, the MTF could be good while the geometric radius is terrible. The RMS on the other hand should be smaller, but you already seen it improve with sampling. The weird edge rays should be investigated…  is there a strong kink at the edge of the first asphere? By the way, that first asphere looks very flat, are you sure it can be molded ?

Sidenote: You may want to copy and paste the text and images of your pdf in your forum post directly. More people may notice you post.


danr1
  • Author
  • Single Emitter
  • 4 replies
  • July 4, 2025


Yes, you are correct regarding the geometrical MTF.  I tried optimizing some more, so this is a slightly different file but fundamentally same design.  Below is the diffraction MTF (64x64 and 1024x1024 sampling looked the same), followed by the geometrical MTF (2048 x 2048, but it looks same as 512x512 and even 128x128, just smoother).  Geometrical MTF is much worse, but I assume diffraction MTF is the accurate one?

Looking at the spot diagrams, they are much larger than I would expect still given the diffraction MTF.  How can I have 74 to 100um rms radius and still have diffraction MTF>35% @ 70cc/mm (period of ~14um).

The first aspheric surface (Surface 5) is kind of wild.  It has largest conic (~14) and r^6 and r^8 coefficients are much larger than those for the other surfaces (-4, and ~32, respectively).

 Surface 5 (in ORANGE below) does have a much lower curvature than the other surfaces.  Best fit sphere for Surface 5 is 3.2mm with max departure of ~2um.  Given that, I will remove the asphere from S5 and reoptimize and see what happens.


Forum|alt.badge.img
  • Fully Spectral
  • 109 replies
  • July 4, 2025

Hi Dan,

Regarding S5, a sphere probably could help optimization, but an asphere is not a problem for manufacturing as this is a plastic lens. The low curvature is more a risk for manufacturing (sphere or asphere).

Can you post the spots without using symbols and with a ray density around ~ 20 (one where we can see the actual individual ray dots), to have an idea of the density ?

Do you also still see these large spots if you shrink a little the stop?

It looks like that would cut these edge rays that do not focus at the right place. Perhaps you have a few rays from the edge of the lens that are very bad, and most rays are good. This would still show in the RMS spot radius. But if the PSF is a very sharp spot with a weak but wide foot, MTF could still be good.


danr1
  • Author
  • Single Emitter
  • 4 replies
  • July 4, 2025

I changed S5 from even asphere with high conic (~14) and high r^6 and r^8 coefficients (-4, and ~32, respectively) and made the surface only spherical and reoptimized.  The diffraction MTF is worse, but now the spot diagram and MTF make sense.

Does anyone know why the Zemax analysis appears to be inaccurate if conic constants are high and/or asphere coefficients are high?  Is there a rule of thumb regarding what magnitude these can be before analysis results should be considered suspect?


danr1
  • Author
  • Single Emitter
  • 4 replies
  • July 5, 2025

Hi Ray,

    I was not changing S5 from asphere to sphere for manufacturability.  It was just that I saw that S5 had only mild departure from sphere and S5 had the rather larger r^6 and r^8 coefficients that I suspect are causing a problem in Zemax’s analysis.  Changing S5 from asphere the spherical with no conic constant confirmed my suspicions.  Both designs look extremely similar after optimization

S5 asphere design:  rms spot size = 73 to 102um, diffraction MTF of >25% @ 68cc/mm.

S5 sphere design:   rms sport size =  4 to 11um, diffraction MTF of > 15% @ 68cc/mm


I don’t believe the S5 asphere design is being modeled correctly by Zemax, but I’m not certain what the solution is.

 Below is the spot diagram you requested (sampling of 20 and no symbols).  Close up spot diagrams are for fields 4 and 7.

Regarding stopping down the aperture stop (AS), you might be on to something:


S5 asphere:  AS=0.37, rms spot size = 73 to 102um, diffraction MTF of >25% @ 68cc/mm

S5 asphere:  AS=0.33, rms spot size = 16 to 26um, diffraction MTF of >10% @ 68cc/mm

This above result is for just a change in AS, I did no reoptimization at the smaller AS.  To me at least the spot size to MTF correlation is more real with the smaller AS.  Note that the rms spot size is being reported for a sampling of 100.

However, there is still the fundamental question of how to model these aspherical surface correctly or ensure that there is some flag to say model is incorrect, because otherwise, one might proceed to fabricate something that does not appear to be modeled correctly by Zemax.


danr1
  • Author
  • Single Emitter
  • 4 replies
  • July 5, 2025

Ray,

    I just reoptimized the S5 asphere design stopped down to AS=0.33.  Again rms spot size is with sampling of 200.


S5 asphere:  AS=0.37, rms spot size = 73 to 102um, diffract MTF of >25% @ 68cc/mm

S5 asphere:  AS=0.33, rms spot size = 16 to 26um, diffract MTF of >10% @ 68cc/mm

S5 asphere optimized:  AS=0.33, rms spot size = 41 to 61um, diffract MTF of >33% @ 68cc/mm


So with the optimization, geometrical spot size goes up dramatically and so does MTF which is just odd.  Only way to rationalize is that there is a strong concentrated spot, surrounded by a wide lower amount of light and that this “plateau” of light surrounding the concentrated spot might explain why MTF curve has this drop in MTF at low frequencies, but then stays much flatter than expected going to higher frequencies.  


Forum|alt.badge.img
  • Fully Spectral
  • 109 replies
  • July 7, 2025

Hi Dan,

Interesting findings.

Have you tried replacing the S5 asphere by a Qcon or Qbfs asphere (Forbes) or even an Extended asphere ? Qcon and Extended can be exactly converted to and from even aspheres.

Extended normalizes the monomials. Qcon, in addition, uses orthogonal terms. The optimization may work around that weird valley. Intui9tively, I would expect that there is a better optimum where spots and MTF would improve.

Do you optimize only on the MTF or on both spot and MTF ? (spot size or wavefront ?) 


Jeff.Wilde
Luminary
Forum|alt.badge.img+3
  • Luminary
  • 510 replies
  • July 9, 2025

@danr1:

I have a suggestion that may help.  I see that your object space refractive is not equal to one (it’s H-K9L glass).  For rays at large angles, such as you have from the edge of your field, this can create massive pupil aberration.  So ray aiming must be used, but I see that your stop surface is an even asphere with a large conic constant, which forces the ray aiming algorithm to work harder than it would if you simply moved the stop to a planar surface immediately in front of the even asphere. 

However, I think the biggest issue is the fact that your object space index is not equal to one.  When going from glass to air, rays at large angles will have much different paraxial traces versus real ray traces.  Attached is a very simple example that shows the pupil aberration changes from zero when the object space index is one, to ~500% when the object space index is 1.5.

So, in your case I would suggest moving the first glass window to surface 1 and leaving surface 0 material blank with a thickness of zero.  Now your optimizations and subsequent MTF results will likely be better behaved.  With this approach, you will be ray tracing from air to glass, then from glass back into air.  This is a much better scenario when comparing paraxial and real ray tracing -- pupil aberration should therefore be substantially smaller, so basic paraxial ray aiming will suffice if needed (and be more robust during optimization).  It wouldn’t hurt to move your stop to a planar surface (or at least one without a crazy large conic constant), but you can experiment with that to see if it makes any difference. 

For optimization, I typically start by minimizing spot size, then based on the result, possibly change to either contrast or wavefront optimization.  

Regards,

Jeff


Reply


Cookie policy

We use cookies to enhance and personalize your experience. If you accept you agree to our full cookie policy. Learn more about our cookies.

 
Cookie settings