I have an LED I am modelling and wanted to ask about the wavelength specifications from the manufacturer and how much I need to insert into Zemax. I am looking to create an even illumination profile along with minimal divergence. I have inputted the correct values for the intensity distribution and luminous flux from the spec sheet, but it doesn't look quite right. I am hoping I can get some advise on the wavelength input. I have attached my files. Thank you.
Cree LED High Power LEDs - Cool White
XPPAWT-H0-0000-0000U50CV
360 lm
115 deg viewing angle
VIS spectrum
Best answer by David
Hi Michael,
I assume that you are using either System Wavelengths or a Spectrum File to define the LED spectrum. (There is a good article on this here.) OpticStudio uses the information in the spectrum data to apportion power to the specified wavelengths according to the given weights. It does this by assigning the same power to each ray while generating a number of rays at each defined wavelength in proportion to the wavelength weight. When using System Wavelengths or a Spectrum File, OpticStudio does not interpolate between wavelengths. To cause OpticStudio to generate rays with a correct spectral density it is therefor necessary to uniformly sample the spectrum.
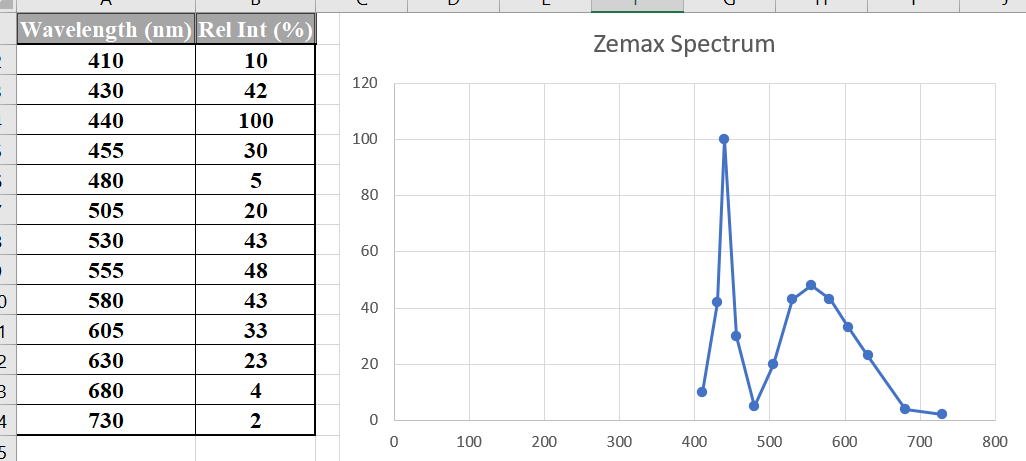
In your Excel spreadsheet I find the following:
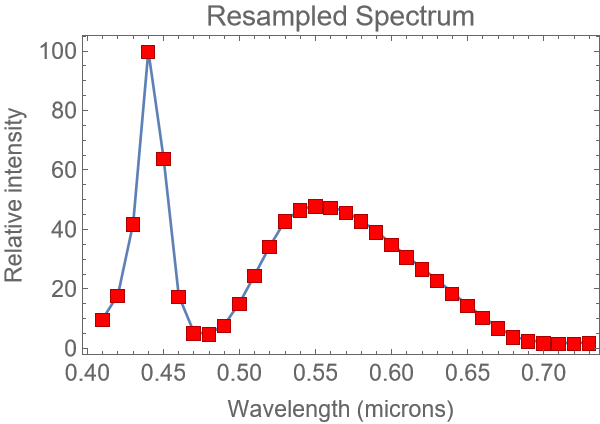
I assume you are using these data to define the spectrum. The sample spacing at the blue end is tighter than at the red end. I resampled this data (in Mathematica) to produce uniform coverage:
I then used these values of wavelengths and weights in a Spectrum File. The source is modeled as a Source Rectangle. The dimensions as given in the spec sheet. The angular distribution is given by a Cosine Exponent of 1, since the distribution appears Lambertian.
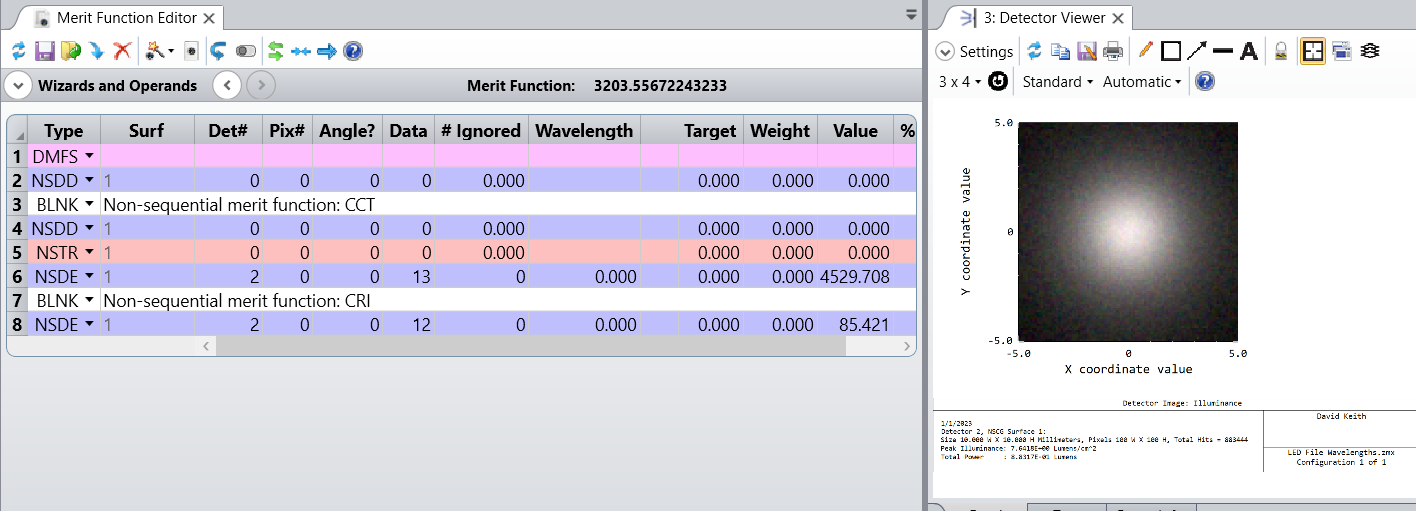
The result looks white:
The detector has Record Spectral Data selected and NSDE operands measure a correlated color temperature of 4530K and a color rendition index of 85.
I attach a ZAR as an example. If this does not address the issues you’re having, please say more and if possible attach a ZAR of your design.
I assume that you are using either System Wavelengths or a Spectrum File to define the LED spectrum. (There is a good article on this here.) OpticStudio uses the information in the spectrum data to apportion power to the specified wavelengths according to the given weights. It does this by assigning the same power to each ray while generating a number of rays at each defined wavelength in proportion to the wavelength weight. When using System Wavelengths or a Spectrum File, OpticStudio does not interpolate between wavelengths. To cause OpticStudio to generate rays with a correct spectral density it is therefor necessary to uniformly sample the spectrum.
In your Excel spreadsheet I find the following:
I assume you are using these data to define the spectrum. The sample spacing at the blue end is tighter than at the red end. I resampled this data (in Mathematica) to produce uniform coverage:
I then used these values of wavelengths and weights in a Spectrum File. The source is modeled as a Source Rectangle. The dimensions as given in the spec sheet. The angular distribution is given by a Cosine Exponent of 1, since the distribution appears Lambertian.
The result looks white:
The detector has Record Spectral Data selected and NSDE operands measure a correlated color temperature of 4530K and a color rendition index of 85.
I attach a ZAR as an example. If this does not address the issues you’re having, please say more and if possible attach a ZAR of your design.
Thank you very much for the explanation of what you did. I apologize as I should have been much more clear on what I was seeing. What happened is that I put 10 detectors above my optical system and the rays were not propagating past the second detector due to the number of ray intersections/segments. I saw the illumination go from a rectangular pattern to speckles past the second detector and was wondering initially if I inputted the wavelength incorrectly somehow. I found the option to include more ray segments/intersections so that they propagated all the way to the last detector. Oddly when I imported my CAD file and created the NS system it limited those values to 20 and 40.
I did institute your wavelength answer as well, so thank you again!