Irradiance in GIA and Efficiency

  • 8 October 2021
  • 6 replies
  • 245 views


Hi,

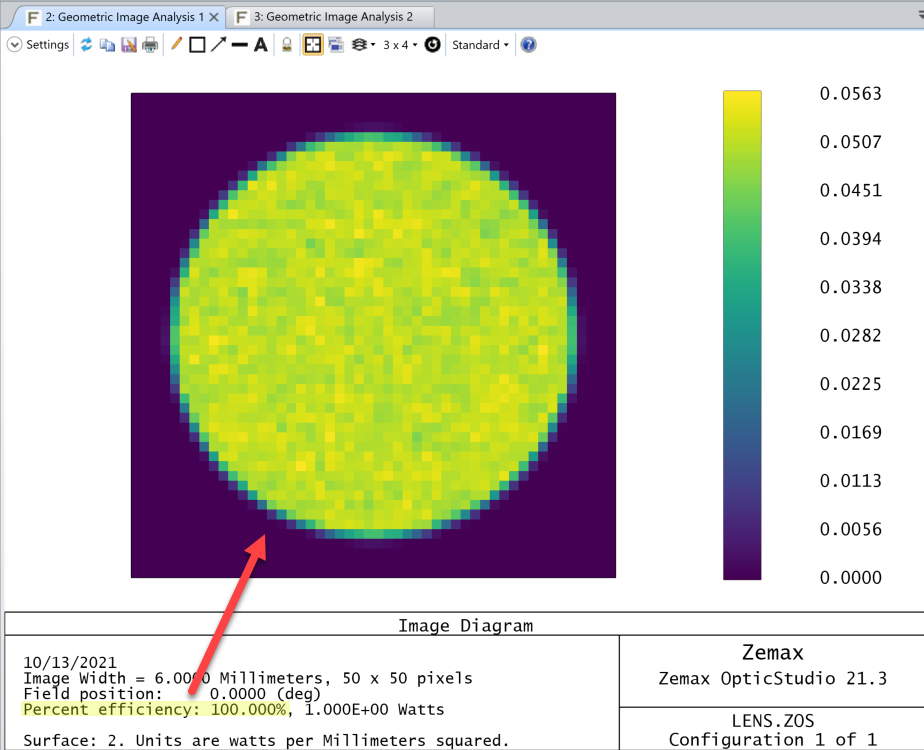
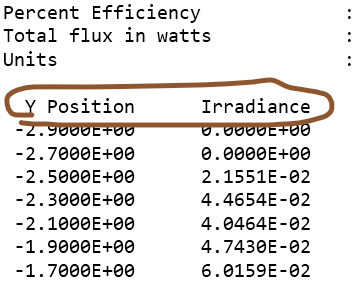
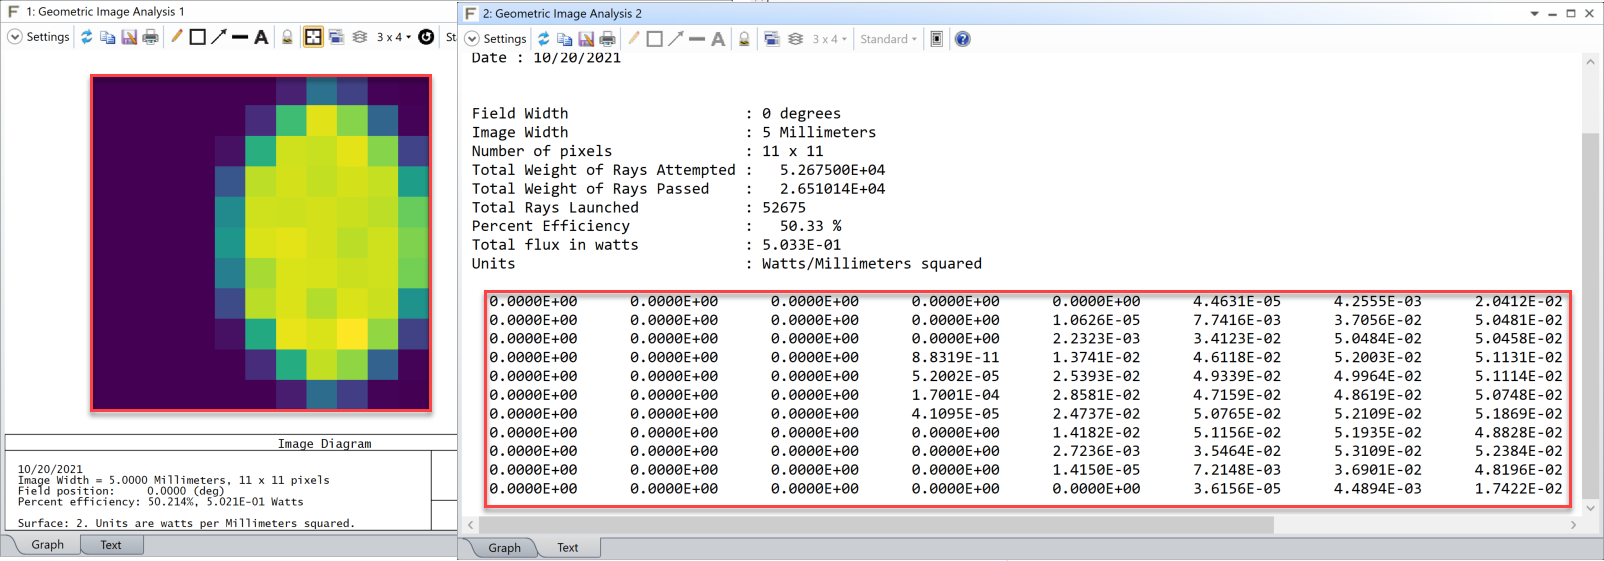
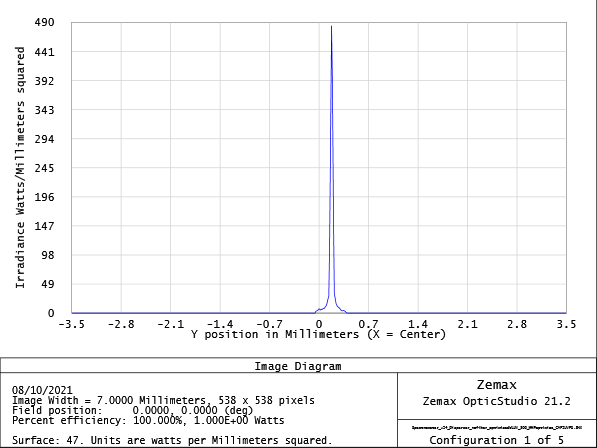
Something does not addup in the calculation of power and efficiency in my spectrometer setup. I have a following reported Irradiance, using 7pixels and 538 pixels( equivalent to 13um pixel size). I used the Total Watts of 1 and I used wavelength input of  255 to 345nm with 5nm apart, which all has the weight of 1. 


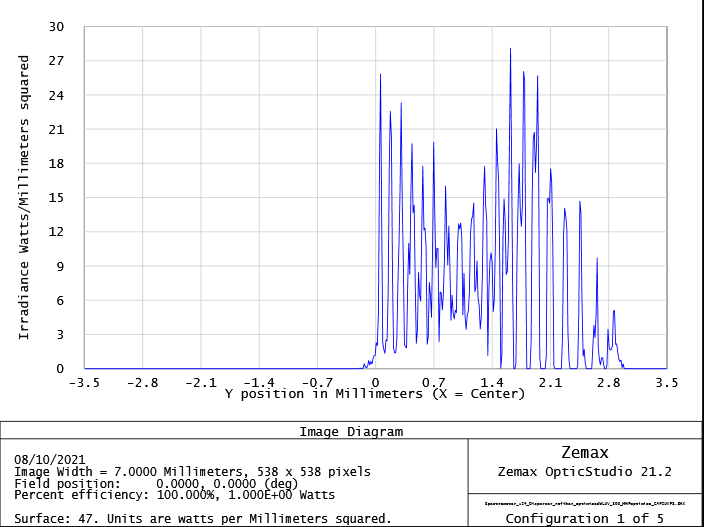
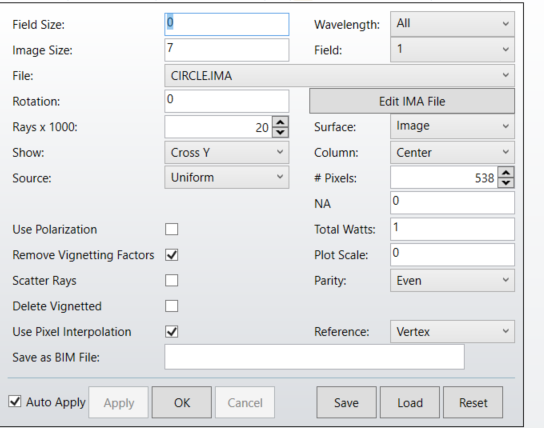
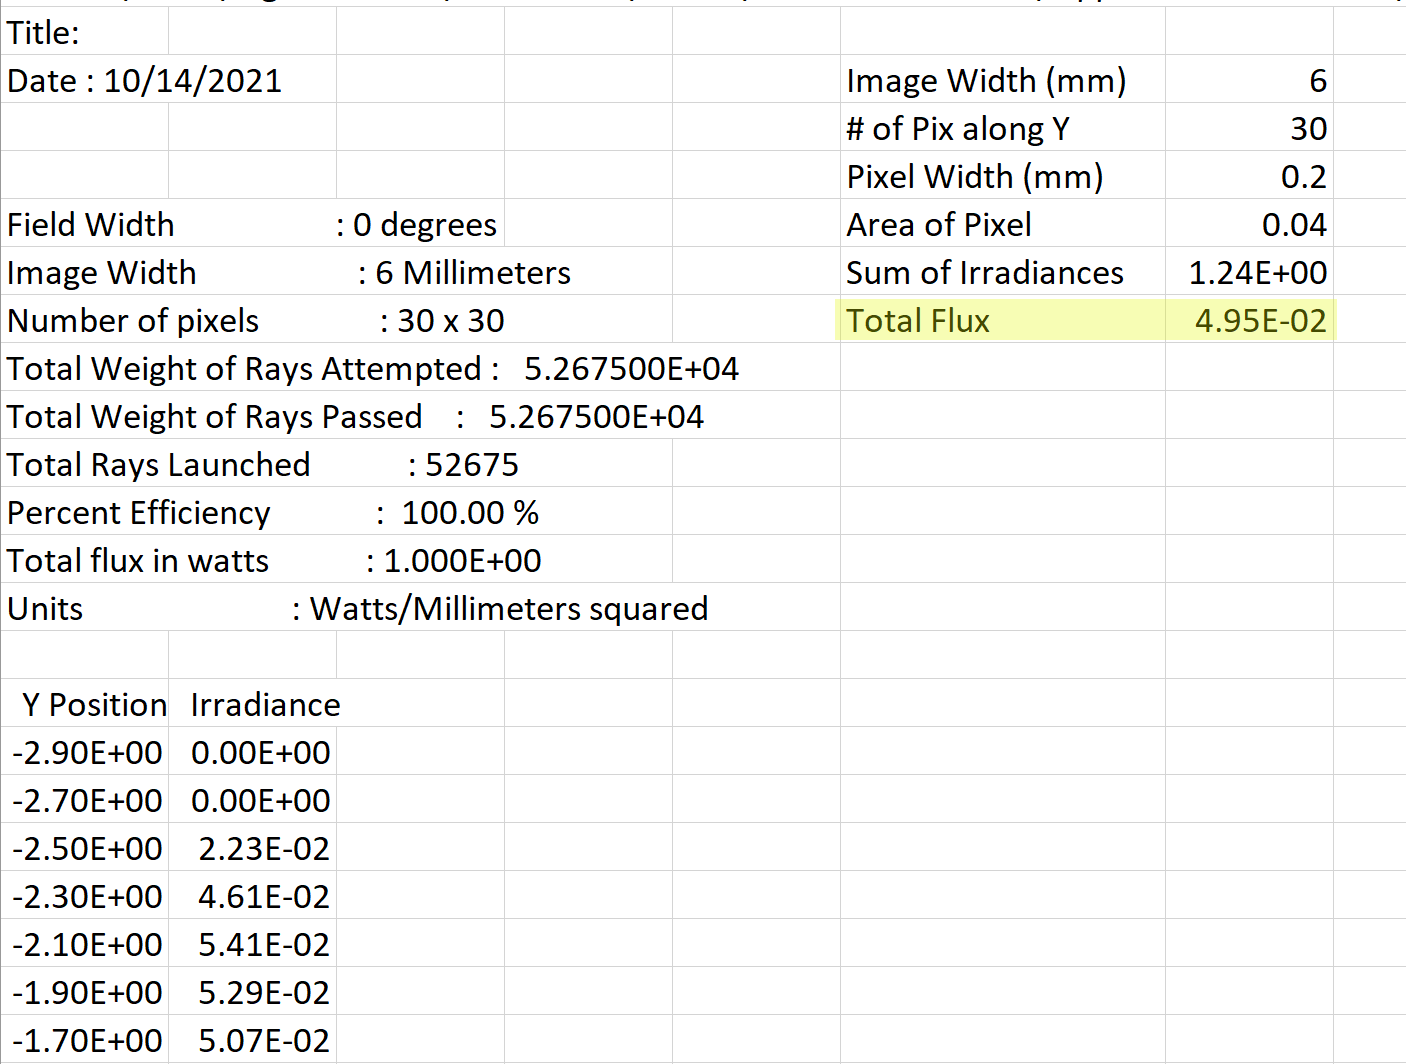
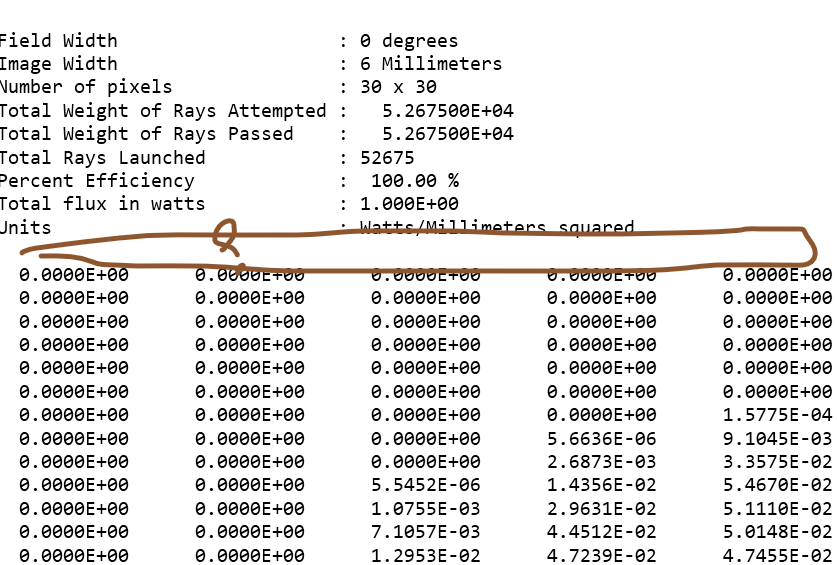
The total efficiency is reported to be 100%. This means 1Watt input should correspond to 1Watt output on the detector to my understanding. However, when I take the numerical data

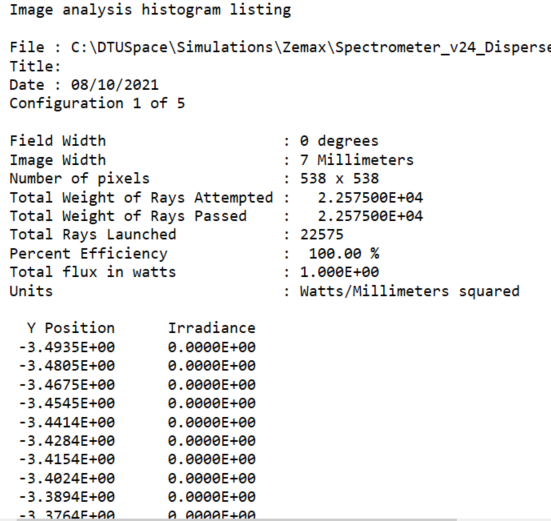
 After adding all the Irradiance together and multiply them by pixel size (13*13*1e-4), I get only 0.35 which is far from 1Watt. How does that work?

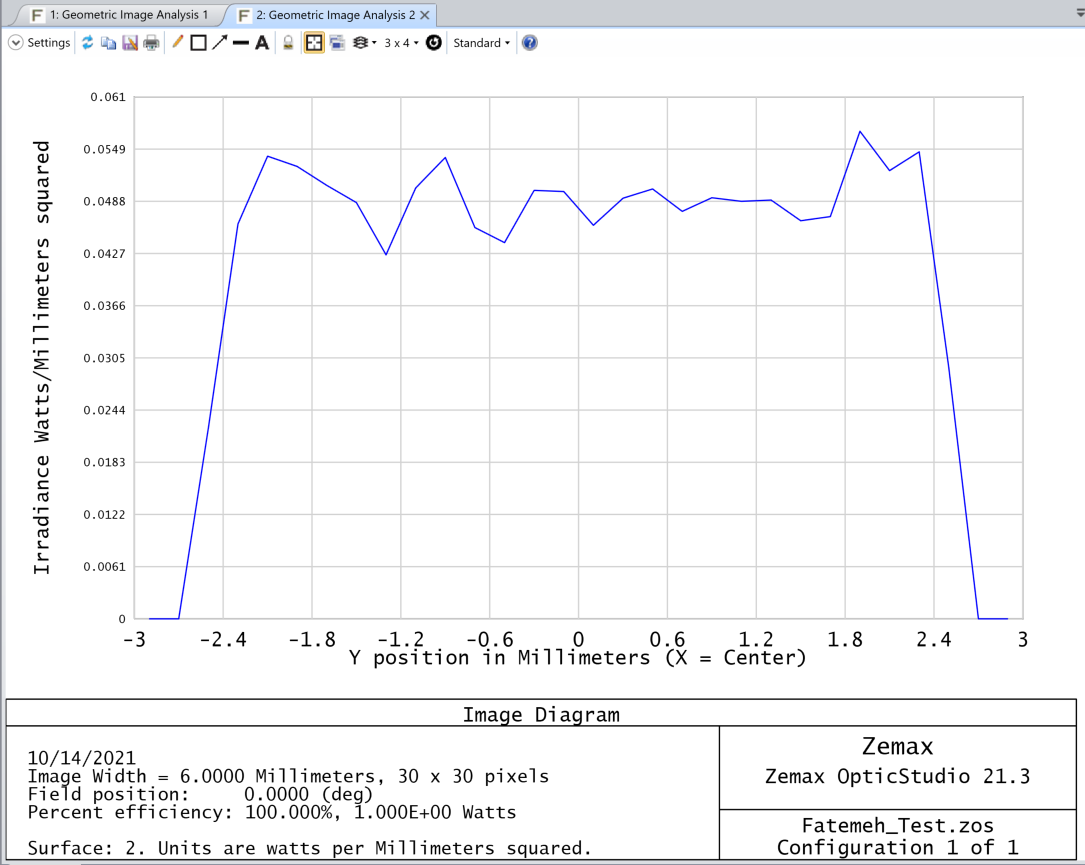
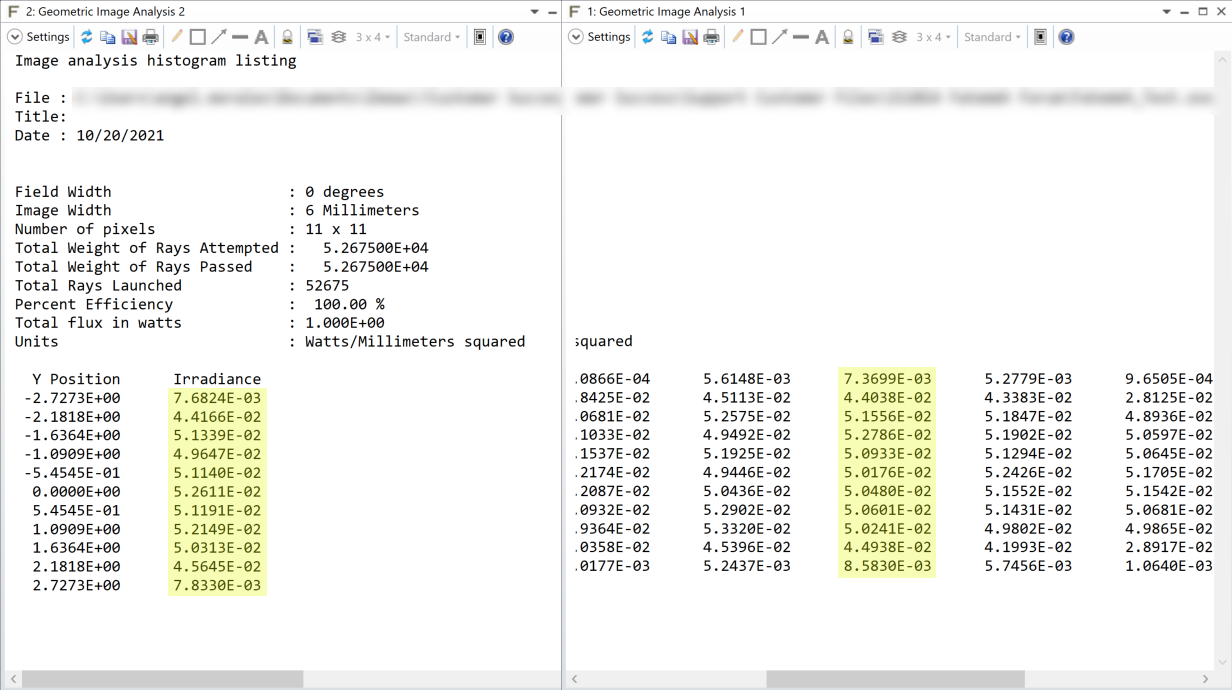
Additionaly I have looked at the result for each wavelengths seperately with 1 Watt as total Watts. 

I added all the raddiance values over the y-position for each wavelength individualy and  multiply that with pixel size (13*13*1e-4). I added at the end all the results together to cover for all the wavelengths, this gave me 5.5Watts. Therefore, I donot understand the 100% efficiency here and why I have more than 1Watt.


Thank you

Fatemeh


6 replies

Userlevel 5
Badge +1

Hi Fatemeh,

Thanks for making a post here on our forums!

To clarify, the 100% efficiency refers to the full image plane defined in your GIA settings. When you look at cross-section data, I would expect the flux computed from this information to be less than your input 1 Watt, since you will be taking a subset of your 2D data:


Second, I think the factor you used is slightly off. Based on your GIA settings, you have 7 mm of full image width divided by 538 pixels. As you mentioned, this comes out to a pixel pitch of ~13 microns. When you get the pixel area in millimeters squared, though, you’d want 0.013 mm x 0.013 mm = 1.69e-4 mm. It seems like you might be taking 13*13*1e-4 = 0.0169 mm, which would give inaccurate results and increase your flux due to the larger area factor.

Let us know if this clears the analysis up for you, and thanks again!

Hi Angel,

Thank you for your response. Your first point where indeed very valid and I understand I should get lower than 1Watt for Y-cut only. 

For the second point it was a typo with 13*13*1e-4 = 0.0169 mm and I do multiply by the correct factor of 0.000169 mm^2 . Sorry for that.

Taking that in mind, then why when I add all the raddiance values over the y-position for each wavelength individualy and  multiply that with pixel size of 0.000169 mm^2, I end up with total power of 5.5Watts. How can I have more power than 1Watt? I am referering to the last image which shows for only one wavelength bin.


Cheers,

Fatemeh


Userlevel 5
Badge +1

Hi again, Fatemeh,

For the data being off by having more than 5x your input power, we’d probably need to take a look at the irradiance data itself. I did a similar calculation in a very simple test file (input collimated beam on a 30 pix x 30 pix image plane), and I got a result that was less than my 1 W input power. Here’s the 1D data:

I copied the text data into Excel so that I could sum the irradiances and multiply to the pixel area:

I attached the file and Excel sheet for your reference. Let us know if this helps a bit more or if there are further questions, and thanks again!

Hi Angel,


Thank you for the response. The question was a bit different for the case I am getting 5.5Watt power. It was the case when I look at the irradiance of each wavelength seperately and add them at the end together. I think the problem is due to the overlap in irradiance between different wavelengths. When I look at all wavelength at once I also get 1Watt power in total. 

One thing I noticed from your excel file in 2D is the text file generated by Zemax seems to be all irradiances. When I display the results in  Surface or False color, there is no header explaining the data like the display mode in Cross X or Y, so I was not sure about the order of data in X and Y in Surface format for example. Will you please clarify the output data format for false color and surface?

Surface display data:

Cross Y display:


Userlevel 5
Badge +1

Hi Fatemeh,

The data from GIA will be the same if you use Surface, False Color, etc. -- they should all be irradiances in terms the units shown in your analysis text output. We can see that the Cross Y center row of pixels in this GIA output has similar results to that shown from the False Color text output. Note that there may be slight differences in the values themselves as it’s not exactly the same set of rays being traced per analysis:

Lastly, thanks for clarifying your earlier GIA issue. When you select a single wavelength in the GIA settings like so:

OpticStudio does indeed assign 1 Watt of power to that whole wavelength. It won’t “know” to separate the input power across all the wavelengths in your system due to the way that the settings are defined in GIA, so it does make sense that running this analysis individually and then summing up the powers would result in >1 Watt. Sorry for missing this detail in my earlier responses!

Let us know if you have any more questions here, and thanks again for your discussion.

Userlevel 5
Badge +1

Hey again, Fatemeh,

Apologies, I realized after posting that you were also asking about the order of the data when you had full 2D irradiance information. The ordering of the pixel data in the Graph output will be the order of the irradiance data displayed in the Text tab. Here’s a coarse resolution with some asymmetric illumination on the image plane to help show what I mean:


Thanks again for your time!

Reply