I am currently engaged in the design of large-scale metasurfaces and am interested in utilizing Zemax to evaluate their performance. I came across a reference that seems to align with my objectives: https://optics.ansys.com/hc/en-us/articles/18254409091987-Large-Scale-Metalens-Ray-Propagation.
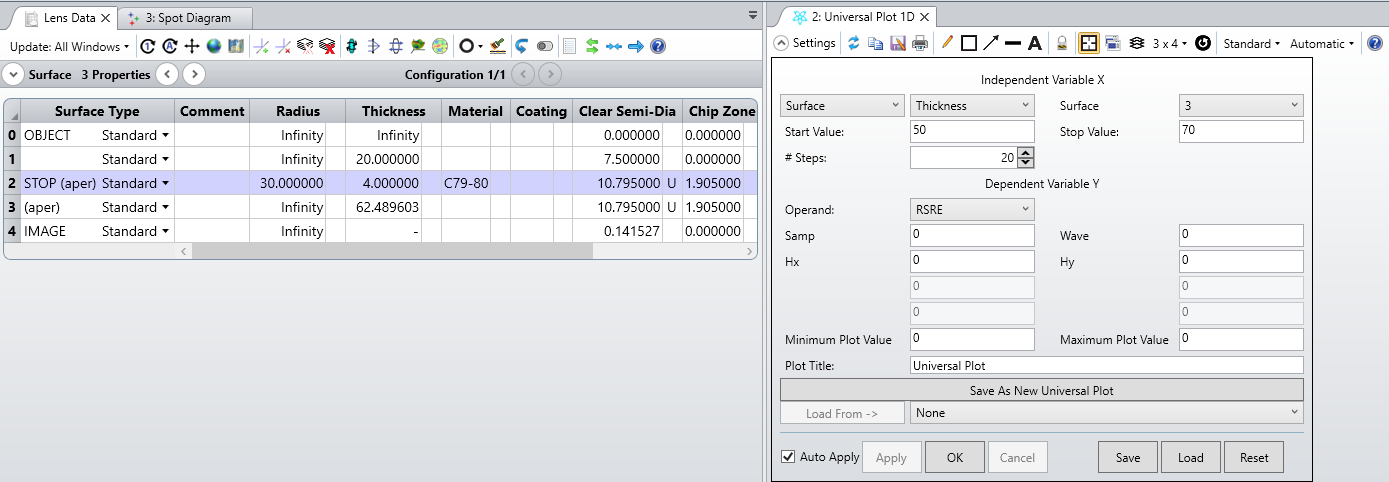
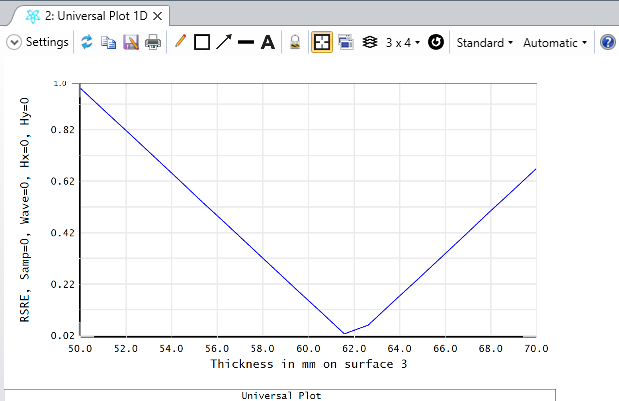
My specific inquiry pertains to the possibility of conducting a scan along the axial (z) direction to accurately locate the focal point. I have observed that the actual focal point of the lens appears to be displaced, and manually adjusting the numbers to shift the image plane's location seems to have its limitations.
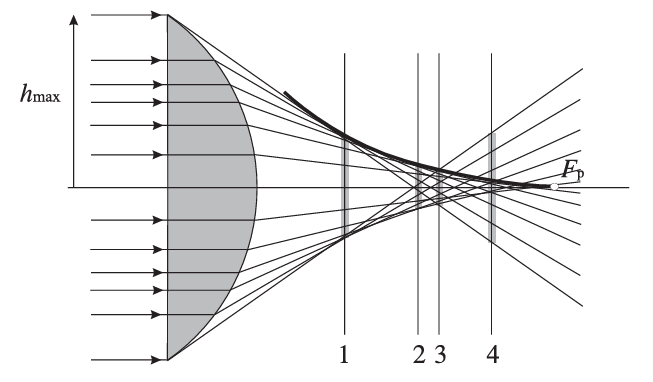
Furthermore, I am interested in generating a plot similar to the thick curve depicted in the figure from the publication by Pedro Carpena and Ana V Coronado (2006, Eur. J. Phys. 27:231). This visualization would significantly aid in pinpointing the precise location where the metalens achieves optimal focus.
Could you advise if there is a specific function within Zemax that facilitates this type of analysis, or suggest an alternative approach to address this challenge? Your guidance would be immensely appreciated.