For example, I want the histogram of distortion, effective focal length histograms. How can I do it?

Solved
How to visualize different performances in histogram for one tolerance run
 +3
+3Best answer by yuan.chen
For the visualization of different results in Histogram, I think the most suitable function to list the performance distribution if you generate a set of MC files.
Here is how we can set this up:
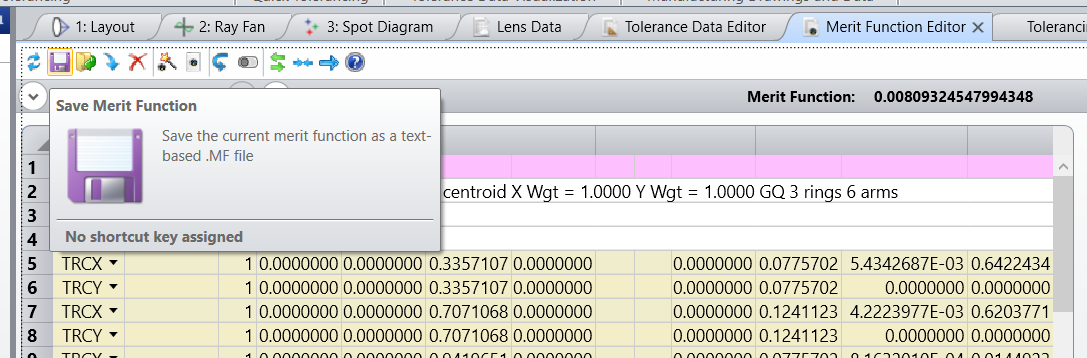
- Create the merit function that contains the data you want to observe and save it to the default merit function folder.
2. Generate the tolerance script and list the data you want to observe. The name of the merit function file is flexible, and you don't need to report adjacent lines, this is just an example.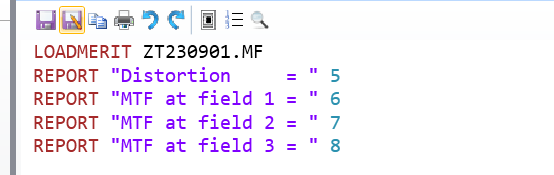
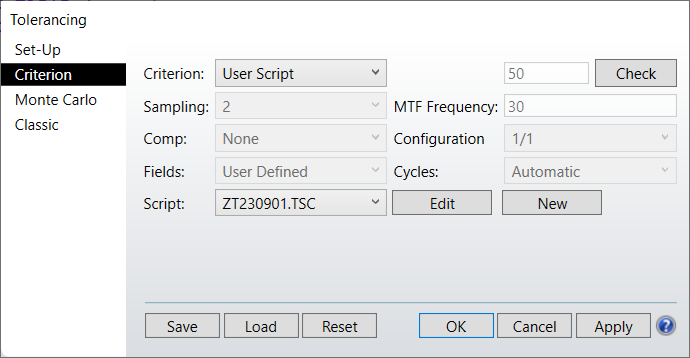
3. Set the tolerance and check Save tolerance data, select User script -> the script you generated.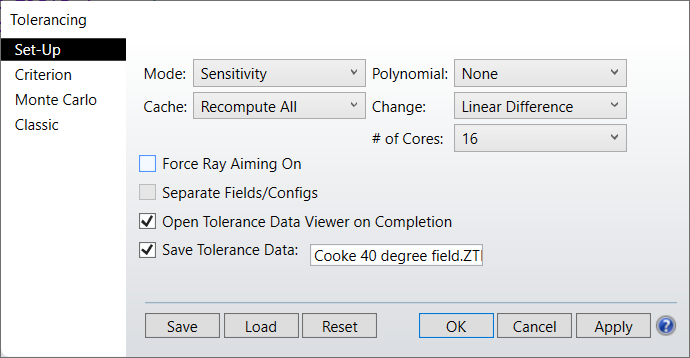
4. Open the Histogram and select the ztd file generated and you can see the histogram of the data you want to visualize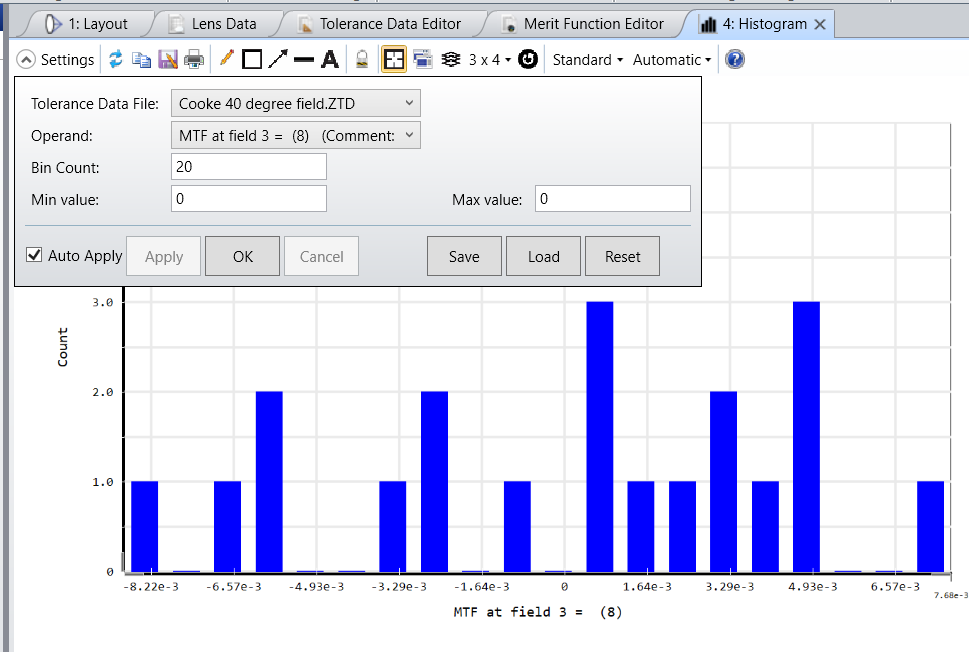
There is a KBA that describes more details.
How to get any optimization operand value in the tolerance report – Knowledgebase (zemax.com)
Enter your E-mail address. We'll send you an e-mail with instructions to reset your password.
Need more help?
To Chinese users:
Do not provide any information or data that is restricted by applicable law, including by the People’s Republic of China’s Cybersecurity and Data Security Laws ( e.g., Important Data, National Core Data, etc.).
不要提供任何受适用法律,包括中华人民共和国的网络安全和数据安全法限制的信息或数据(如重要数据、国家核心数据等)。