Hi! I’m trying to model a field flattening lens and I’d like to verify the spot size variability across my image field as a function of input angle to the system. Using coordinate breaks, I set up a mirror that rotates to specific angles (set by the Configuration parameter PRAM), allowing me to vary the angle of incidence into my lens.
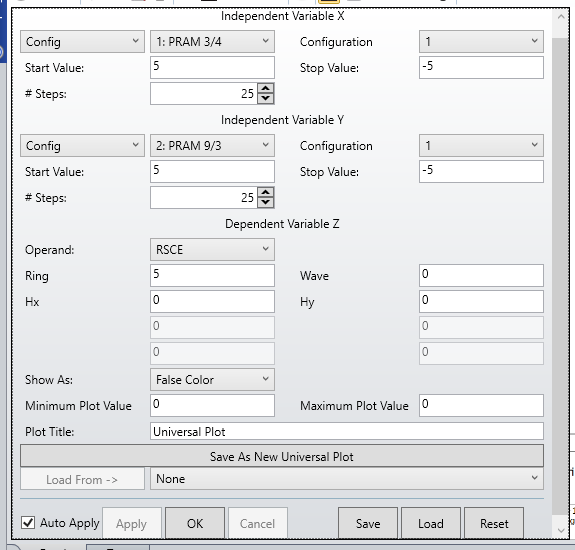
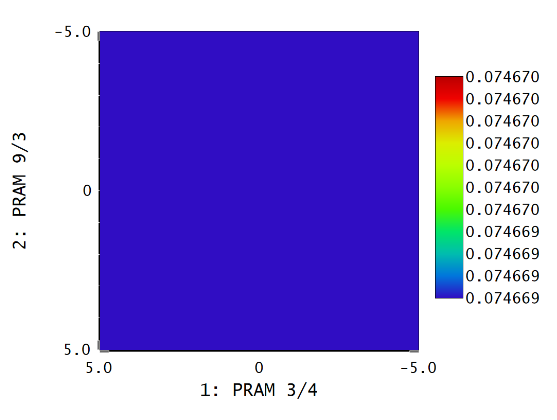
I’m using the 2D Universal Plot with Config: PRAM as the two independent variables and RSCE as the dependent variable. The plot comes out as a solid color (suggesting there is no variability across the image plane). This result seems wrong, as other tools (like RMS vs Wavelength) show the different configurations lead to different spot sizes.
Let me know if I can provide more information. Unfortunately, I can’t share my zmx model. Thank you!