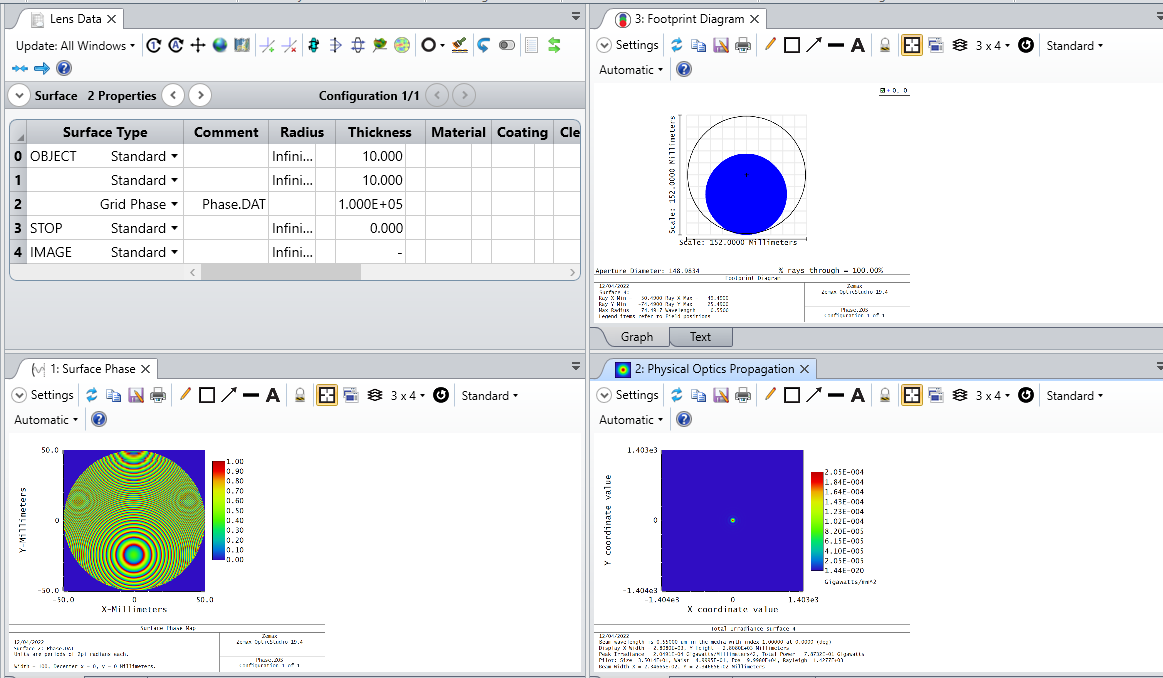
Hi I have created a lens phase profile with shifted focal position and this is imported into OpticStudio for Grid Phase surface. The POP does not seem to respond to or recognize this phase surface. The Surface Phase is working and is consistent with the phase profile. The Footprint Diagram is also responding as expected. But the POP seems to always display the same beam. Could you please help?
Best answer by Jeff.Wilde
Ok, I received some very useful feedback from Zemax technical support (Takashi Matsumoto). It turns out that illumination of the Grid Phase or Grid Sag surface by a plane wave can cause the associated pilot beam used internally by POP to acquire a significant phase curvature (assuming the “Best Fit” default setting is being used). Since the phase variation imparted by the surface is measured relative to the pilot beam wavefront, a pilot beam with curvature can produce strange patterns when the user looks at the “Phase” of the beam leaving the surface. To overcome this problem, the user should select a pilot radius option of “Plane” at the Grid Phase (or Grid Sag) surface:
This ensures the pilot beam will maintain a flat wavefront at the surface output (hence the pilot beam waist is forced to be located at the surface output). Now the phase profile observed in POP agrees with that displayed using the Surface Phase analysis window, at least for the case in which the Grid Phase surface is a quadratic phase surface (i.e., mimicking a simple paraxial lens with weak power).
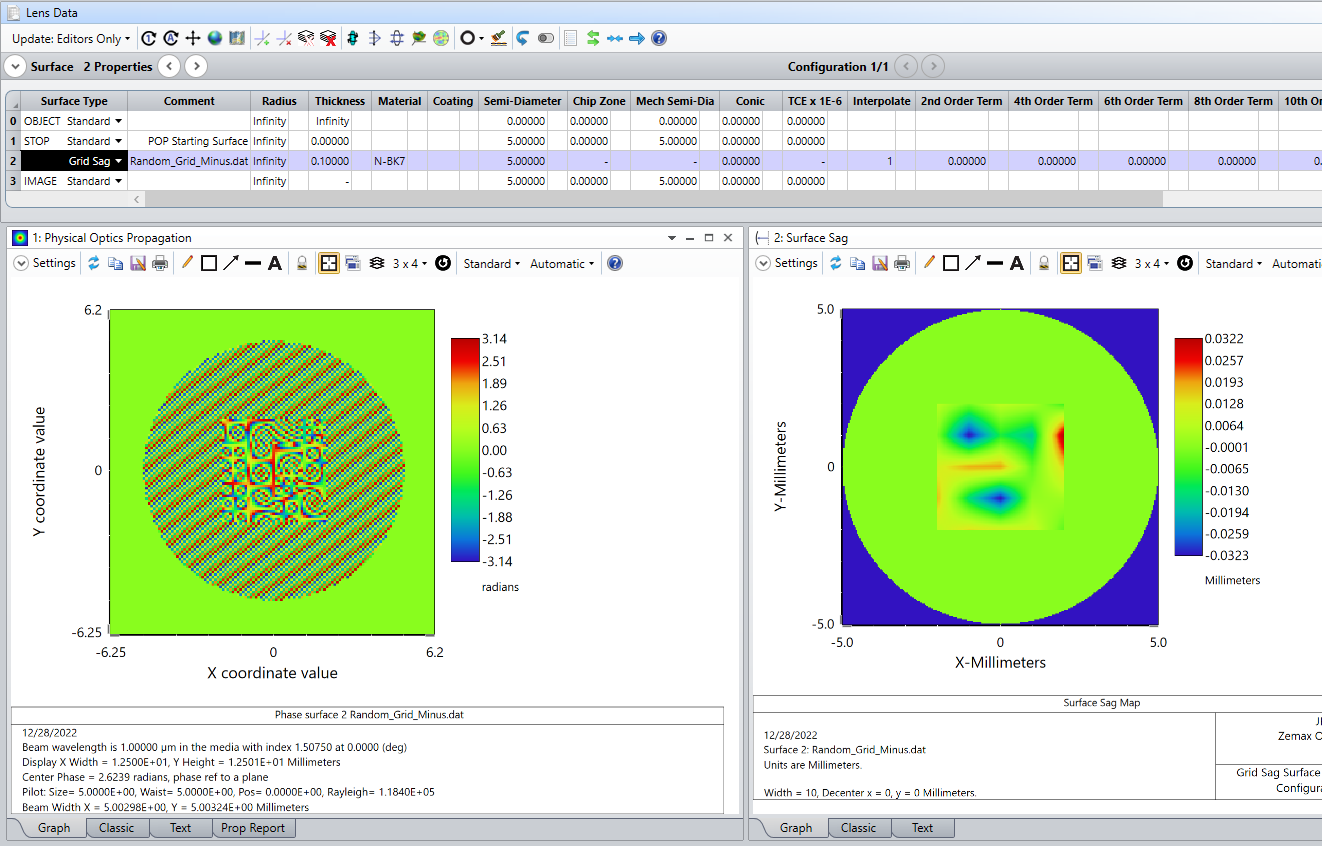
However, there is one more detail that is somewhat problematic. If the Grid Phase/Sag surface causes the chief ray to deflect, then the POP coordinate system z-axis will no longer be aligned with the optical axis because POP locally follows the chief ray. In this case the phase observed in POP will display a fringe pattern associated with the tilt of the off-axis chief ray. Here is an example using one of the example Grid Sag profiles provided with OpticStudio.
For purposes of modeling a diffractive optical element (DOE), it’s probably better to use a custom source ZBF file in POP. More detail can be found here:
I am currently trying to use POP to model diffraction from a Grid Phase surface, unfortunately with only very limited success. I came across the post above, which reports a similar problem, so I thought I would provide additional detail.
First, after seeing some strange behavior in POP when using a fairly complicated and high-resolution Grid Phase surface, I decided to undertake debugging with a simpler phase pattern (radially-symmetric quadratic phase profile spanning 0 to 1 radian) having lower-resolution (65 x 65), then gradually increase the spatial sampling to see what happens. In all cases, I used the Surface Phase plot to confirm that my .dat files were correct.
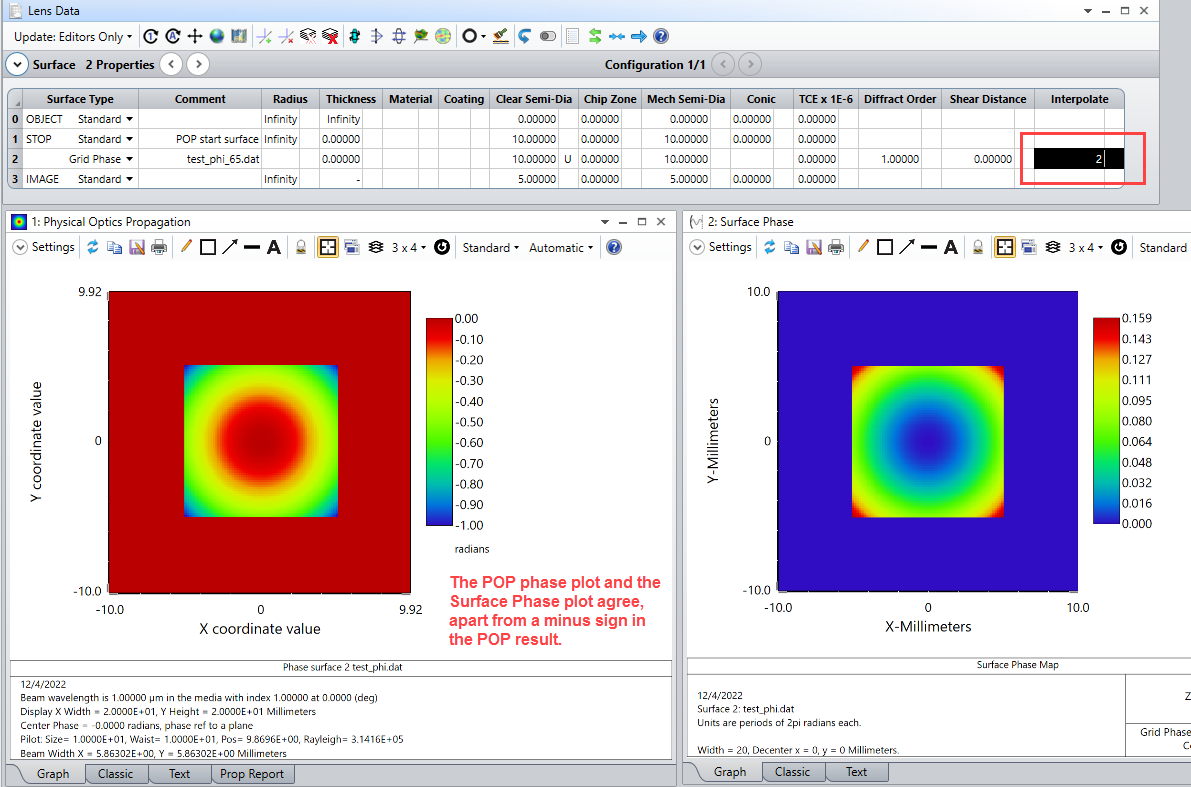
For the 65 x 65 grid case, POP appears to provide the correct phase profile when setting the “Interpolate” surface value to 2 (which designates pixelation mode), although POP reports the phase variation to be 0 to -1 (instead of 0 to +1 as in the .dat file, which is what the Surface Phase plot shows):
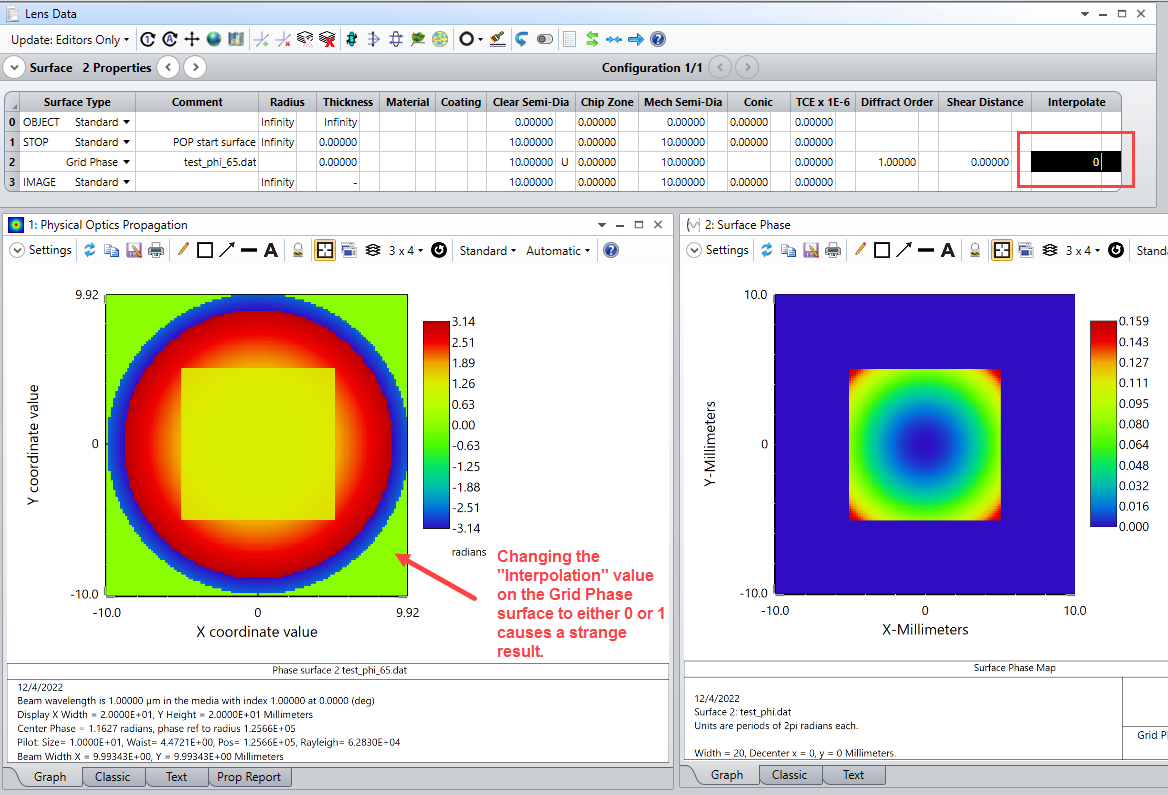
However, when the interpolate value is changed to 0 or 1 (bicubic spline or linear interpolation, respectively), a very strange result appears in the POP phase:
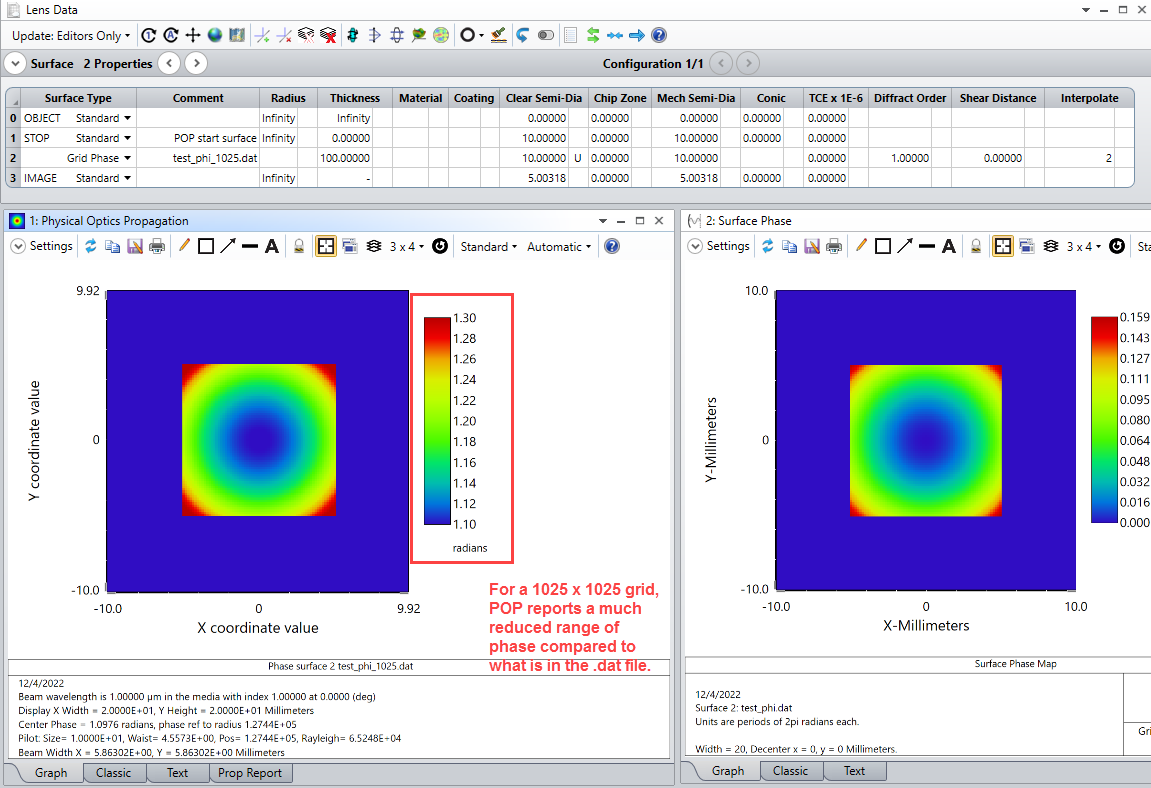
In any event, the Interpolate = 2 value seems to work for grids up to 257 x 257 in size. By the way, I’m using odd values for sampling to ensure the center of the grid lies on the optical axis. However, when I increase the sampling to 513 x 513, the reported phase values in POP shift with what appears to be a constant positive offset. Upon a further increase in sampling to 1025 x 1025, the phase values in POP change more dramatically, such that the spread in phase is much smaller than 1 radian as designated in the .dat file:
The Surface Phase plot continues to look good, so I know the .dat file is constructed properly. For more complicated phase patterns at high sampling resolution, I see even stranger results, with the spatial region over which POP reports non-zero phase values changing shape from square to circular, as if some sort of smaller circular aperture is being applied.
Lastly, when using the Grid Sag surface, similar problems arise, and I can never see reasonable results for any level of grid sampling. This could be because the Grid Sag surface only allows Interpolation values of 0 and 1 (no pixelation), which I just showed are problematic with the Grid Phase surface. It’s time for me to contact tech support with some of these test models...
Ok, I received some very useful feedback from Zemax technical support (Takashi Matsumoto). It turns out that illumination of the Grid Phase or Grid Sag surface by a plane wave can cause the associated pilot beam used internally by POP to acquire a significant phase curvature (assuming the “Best Fit” default setting is being used). Since the phase variation imparted by the surface is measured relative to the pilot beam wavefront, a pilot beam with curvature can produce strange patterns when the user looks at the “Phase” of the beam leaving the surface. To overcome this problem, the user should select a pilot radius option of “Plane” at the Grid Phase (or Grid Sag) surface:
This ensures the pilot beam will maintain a flat wavefront at the surface output (hence the pilot beam waist is forced to be located at the surface output). Now the phase profile observed in POP agrees with that displayed using the Surface Phase analysis window, at least for the case in which the Grid Phase surface is a quadratic phase surface (i.e., mimicking a simple paraxial lens with weak power).
However, there is one more detail that is somewhat problematic. If the Grid Phase/Sag surface causes the chief ray to deflect, then the POP coordinate system z-axis will no longer be aligned with the optical axis because POP locally follows the chief ray. In this case the phase observed in POP will display a fringe pattern associated with the tilt of the off-axis chief ray. Here is an example using one of the example Grid Sag profiles provided with OpticStudio.
For purposes of modeling a diffractive optical element (DOE), it’s probably better to use a custom source ZBF file in POP. More detail can be found here: