Hi Zemaxers


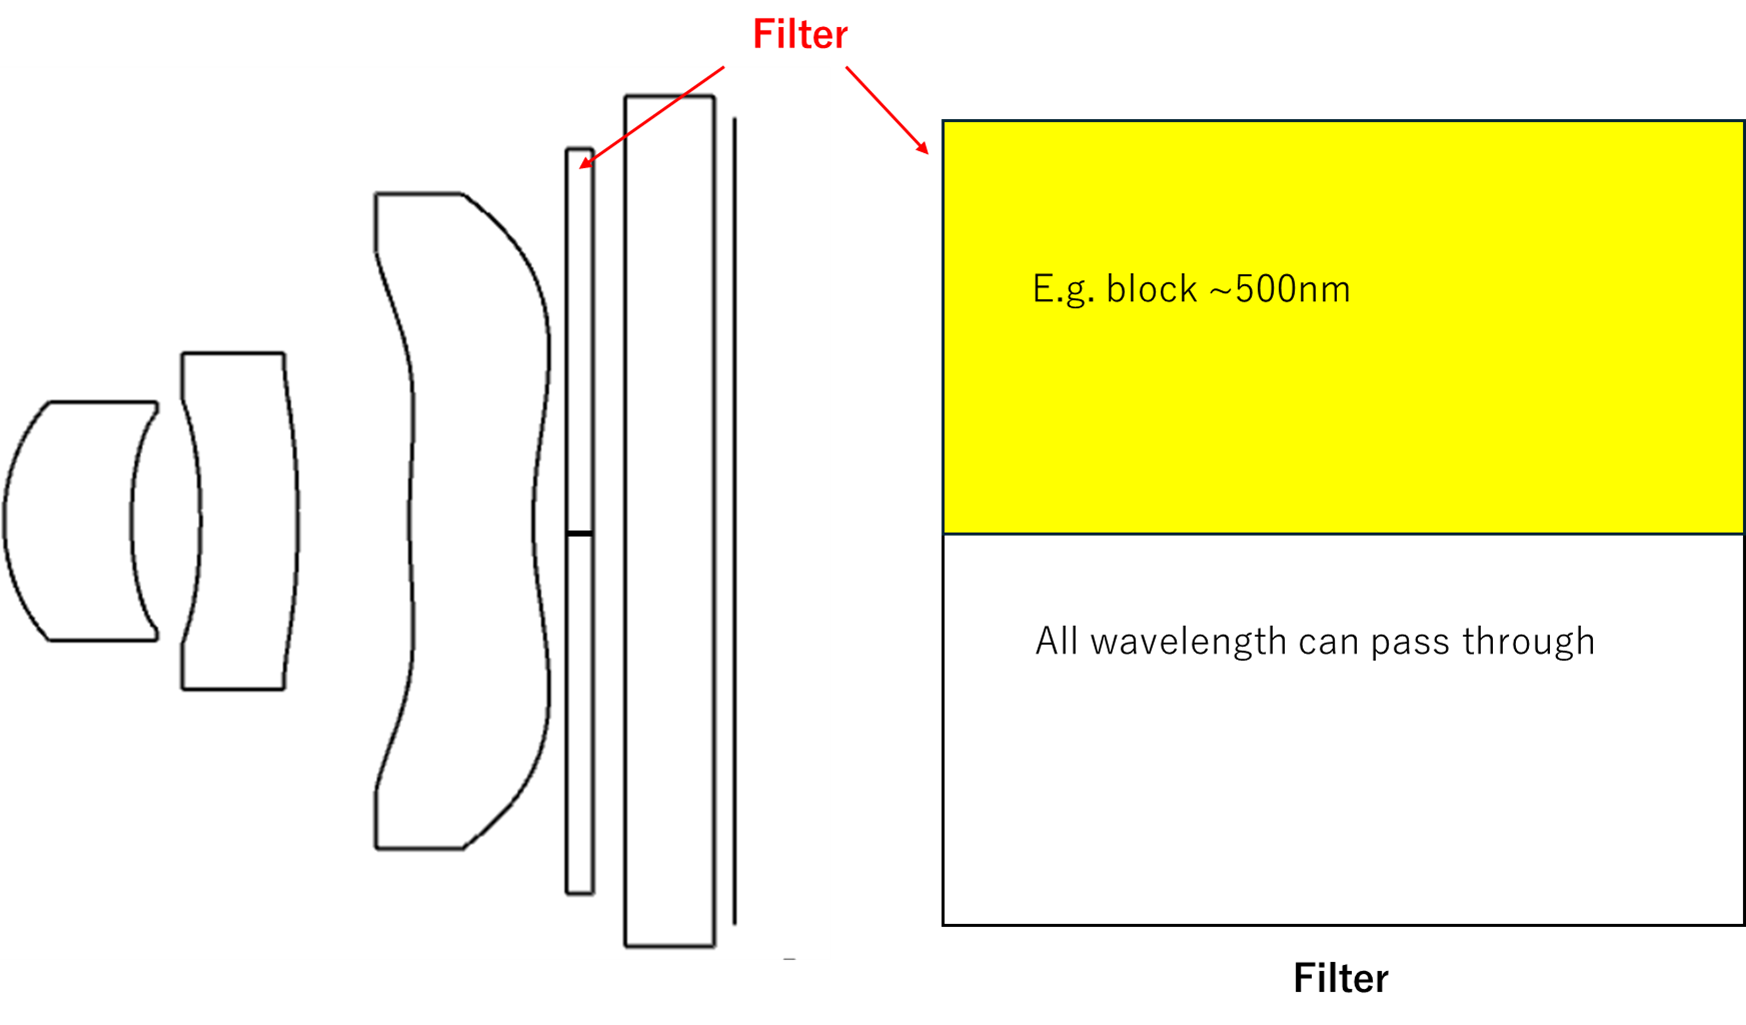
 In sequential mode, how to set a filter like below? or is it possible to set such a layout in sequential mode?

The filter has two parts, the upper area blocks 500nm and below, and the other half is OK for all wavelengths.


Best regards

YANG

Hi Yang,

In sequential mode, a ray cannot “skip” a surface so you cannot simply have a single configuration with a 500nm band pass filter that is decentered.  However, you can split your image plane into 2 halves with multi-configs, use a TABLE coating to create a cutoff filter and then use a number of paired down analysis which can merge the 2 configurations back together (Spot Diagram, Footprint Diagram, Geometric Image Analysis, Huygens PSF, Huygens MTF).

However, the better approach would be to create a User Defined Surface and leverage the UD->rel_surf_tran property.  In the User Data structure, you have access to the ray’s XY coordinates (UD->x and UD->y) and in the Fixed Data structure, you have access to the ray’s wavelength (FD->wavelength).  So the pseudo code in case 5 of the UDS would look something like this:

case 5:
if (UD->y >= 0.0 && FD->wavelength >= 0.5)
{ UD->rel_surf_trans = 0.0; }

if (FD->cv == 0.0){
if (Refract(FD->n1, FD->n2, &UD->l, &UD->m, &UD->n, UD->ln, UD->mn, UD->>)) return(-FD->surf);
} else {
/* not a plane, copy code from UDS example for snell’s law refracting */

}
break;

There are 8 different UDS filter examples in the Zemax\DLL\Surfaces folder that can help you get started.

P.S. If you can use non-sequential, I would suggest doing that.  This is a trivial problem in non-sequential mode.

Hi Michael

 Thanks for your reply. I think the User Defined Surface can make it.

I will have a try

 Thanks again!


Yang


Hi Yang,

In sequential mode, a ray cannot “skip” a surface so you cannot simply have a single configuration with a 500nm band pass filter that is decentered.  However, you can split your image plane into 2 halves with multi-configs, use a TABLE coating to create a cutoff filter and then use a number of paired down analysis which can merge the 2 configurations back together (Spot Diagram, Footprint Diagram, Geometric Image Analysis, Huygens PSF, Huygens MTF).

However, the better approach would be to create a User Defined Surface and leverage the UD->rel_surf_tran property.  In the User Data structure, you have access to the ray’s XY coordinates (UD->x and UD->y) and in the Fixed Data structure, you have access to the ray’s wavelength (FD->wavelength).  So the pseudo code in case 5 of the UDS would look something like this:

case 5:
if (UD->y >= 0.0 && FD->wavelength >= 0.5)
{ UD->rel_surf_trans = 0.0; }

if (FD->cv == 0.0){
if (Refract(FD->n1, FD->n2, &UD->l, &UD->m, &UD->n, UD->ln, UD->mn, UD->>)) return(-FD->surf);
} else {
/* not a plane, copy code from UDS example for snell’s law refracting */

}
break;

There are 8 different UDS filter examples in the Zemax\DLL\Surfaces folder that can help you get started.

P.S. If you can use non-sequential, I would suggest doing that.  This is a trivial problem in non-sequential mode.


Hi Michael and zemaxers,

 I have tried the UDS but got the result not as I thought

y>=0 && wave >=0.5   rel_surf_tran =0

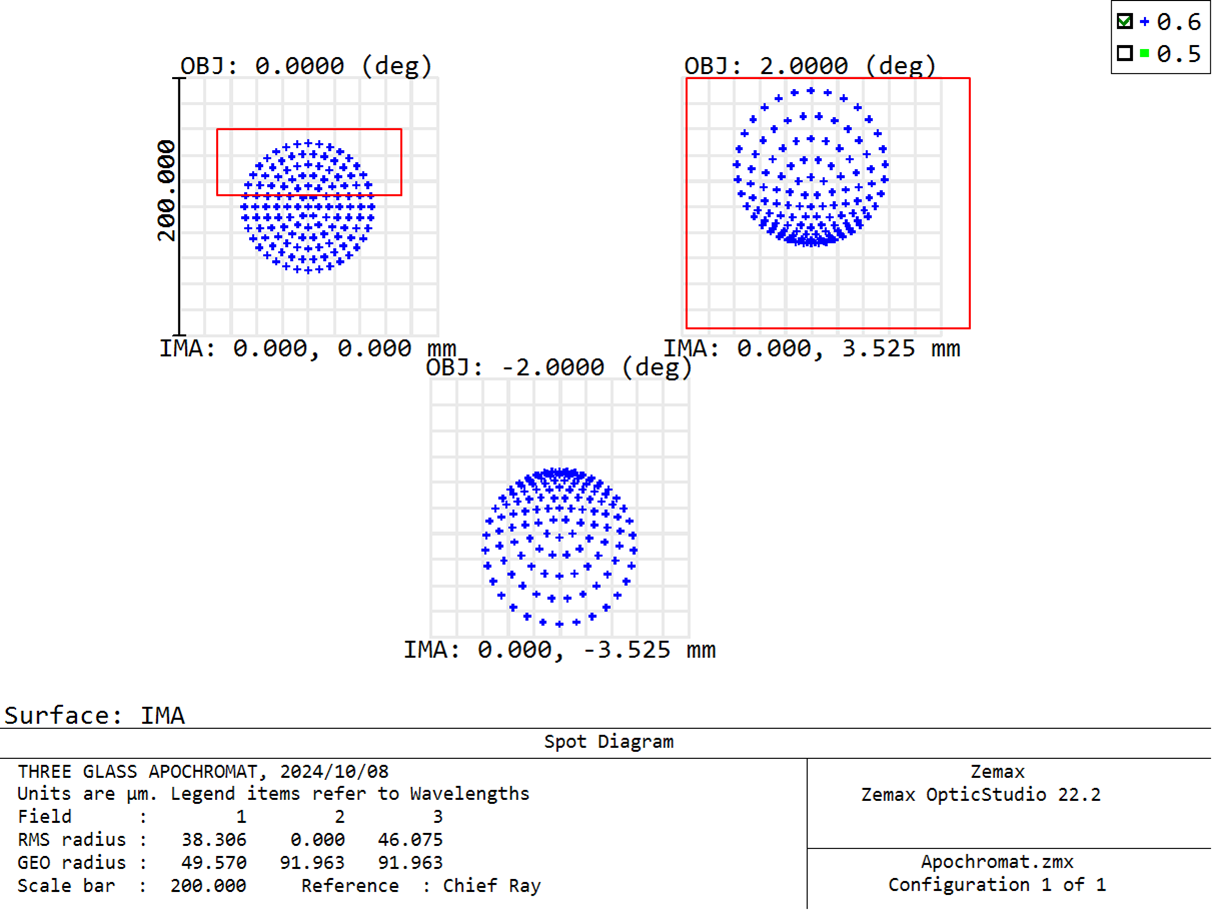
there shall be no spot in red rectangle area of the pic below, right?

I am just wondering where I am wrong .


Would you please have a check with my file?


Thanks


Yang


@Yang.Yongtao 


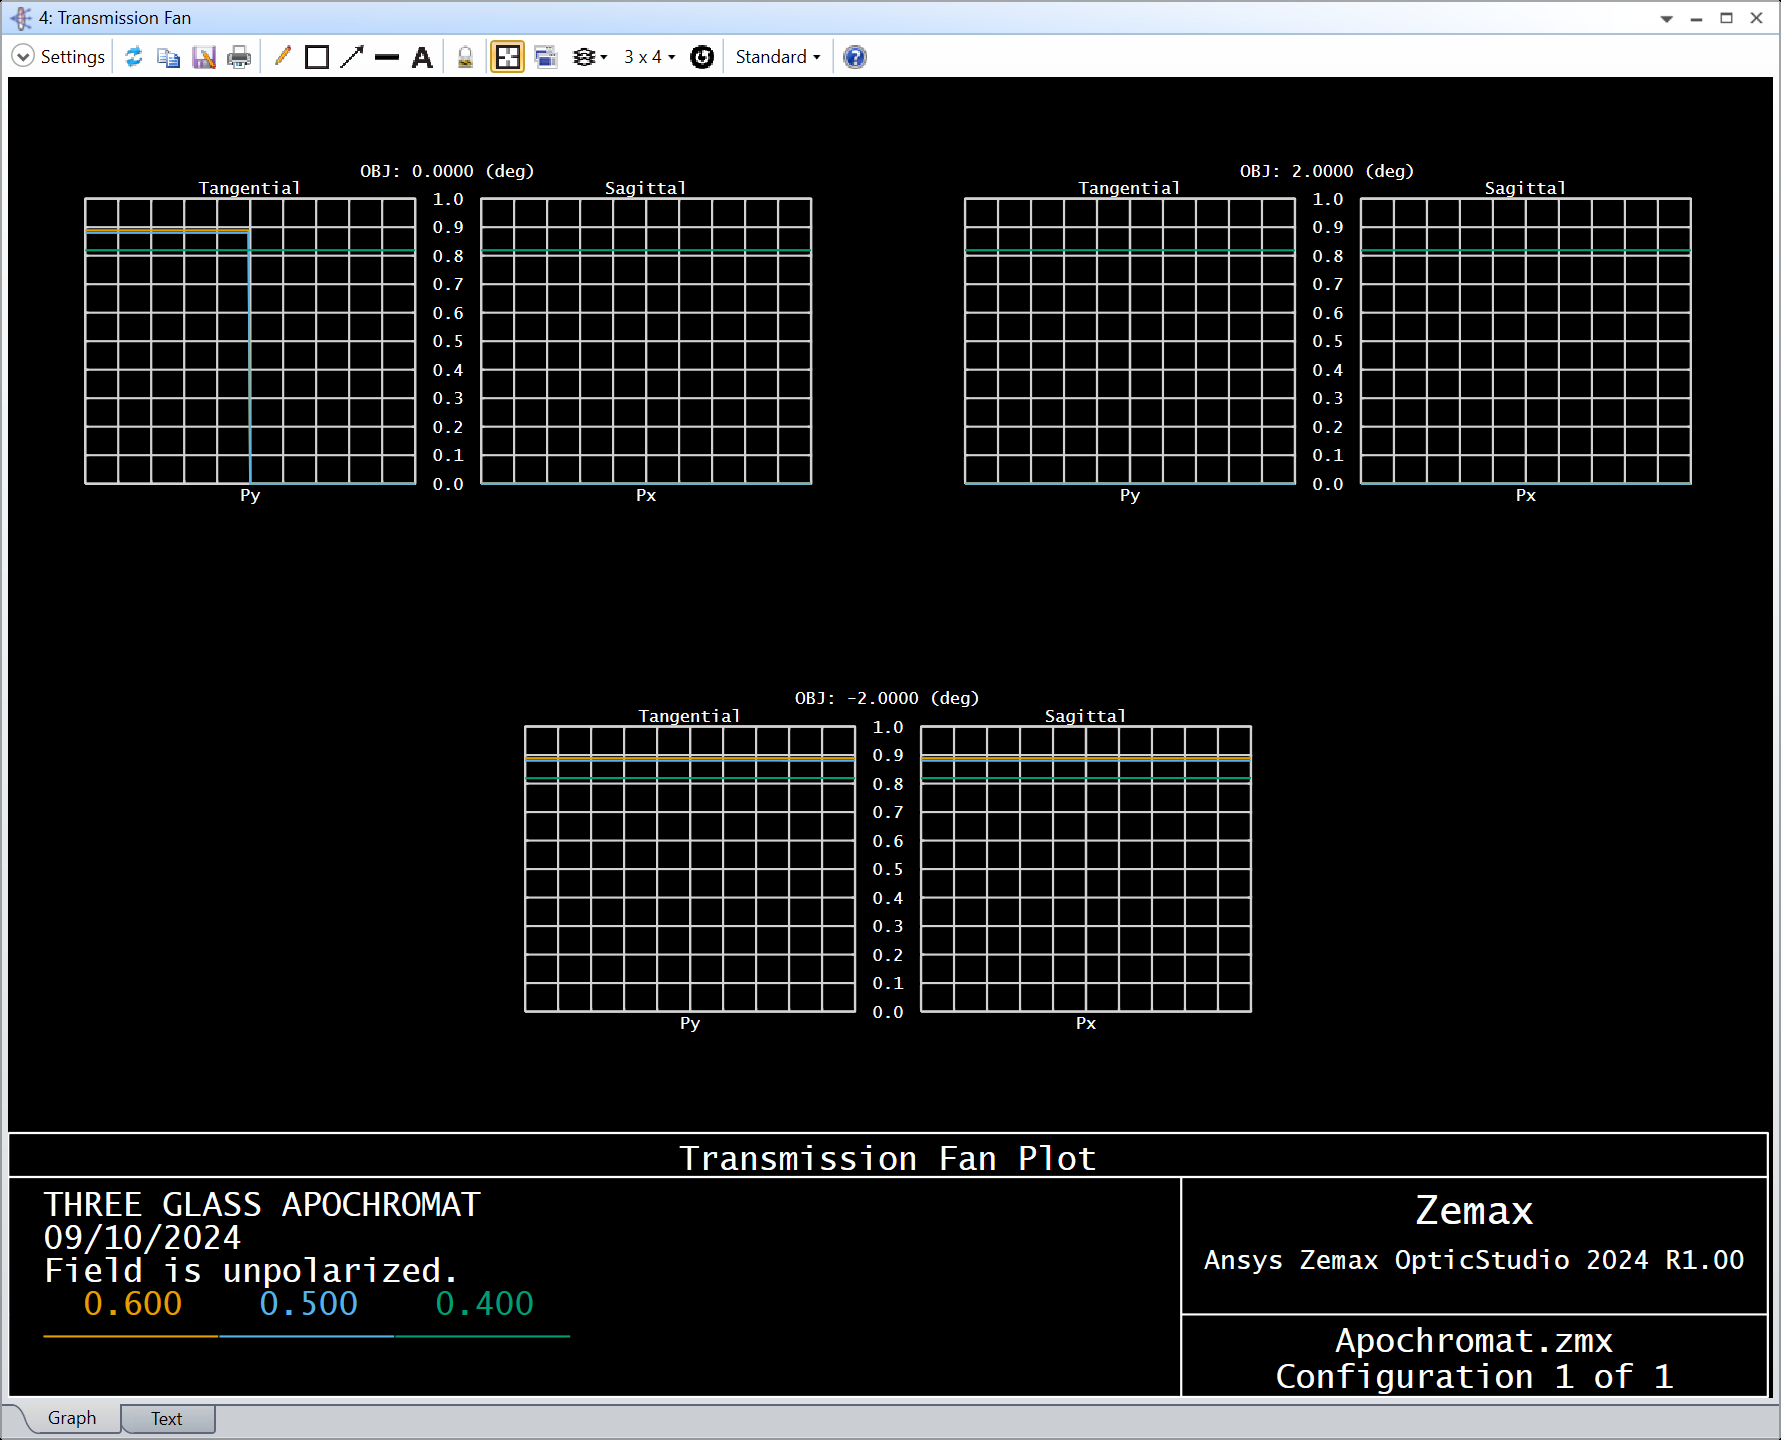
From what I can test, the DLL works (I didn’t look at the code, I’m assuming it has been programmed correctly). If you run a Analyze..Polarization..Transmission Fan this is what you get (I added an additional wavelength at 400nm):

400nm is transmitted all the way across field points. 500nm and 600nm are partially blocked at 0deg and the cutoff is at Py = 0. At 2deg, 500nm and 600nm are totally blocked. At -2deg, 500nm and 600nm are transmitted.

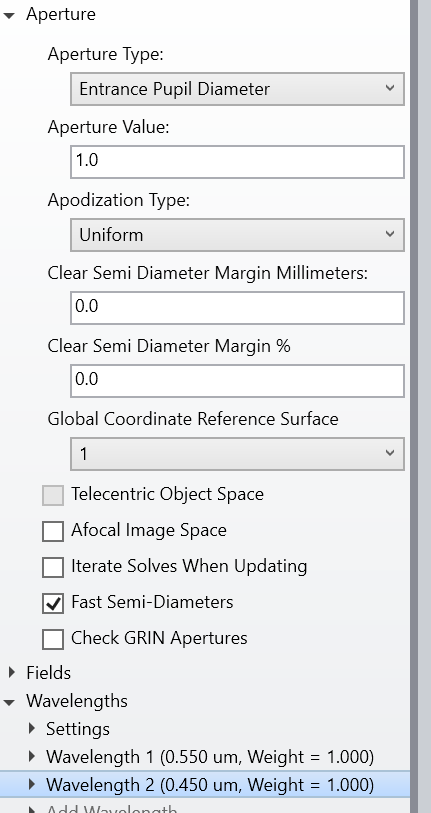
The issue seem to be with the Spot Diagram. The Spot Diagram always shows the ray landing coordinates irrespective of their transmission. Interestingly, checking/unchecking Use Polarization didn’t have a significant effect. I did another dummy test on a dummy file:

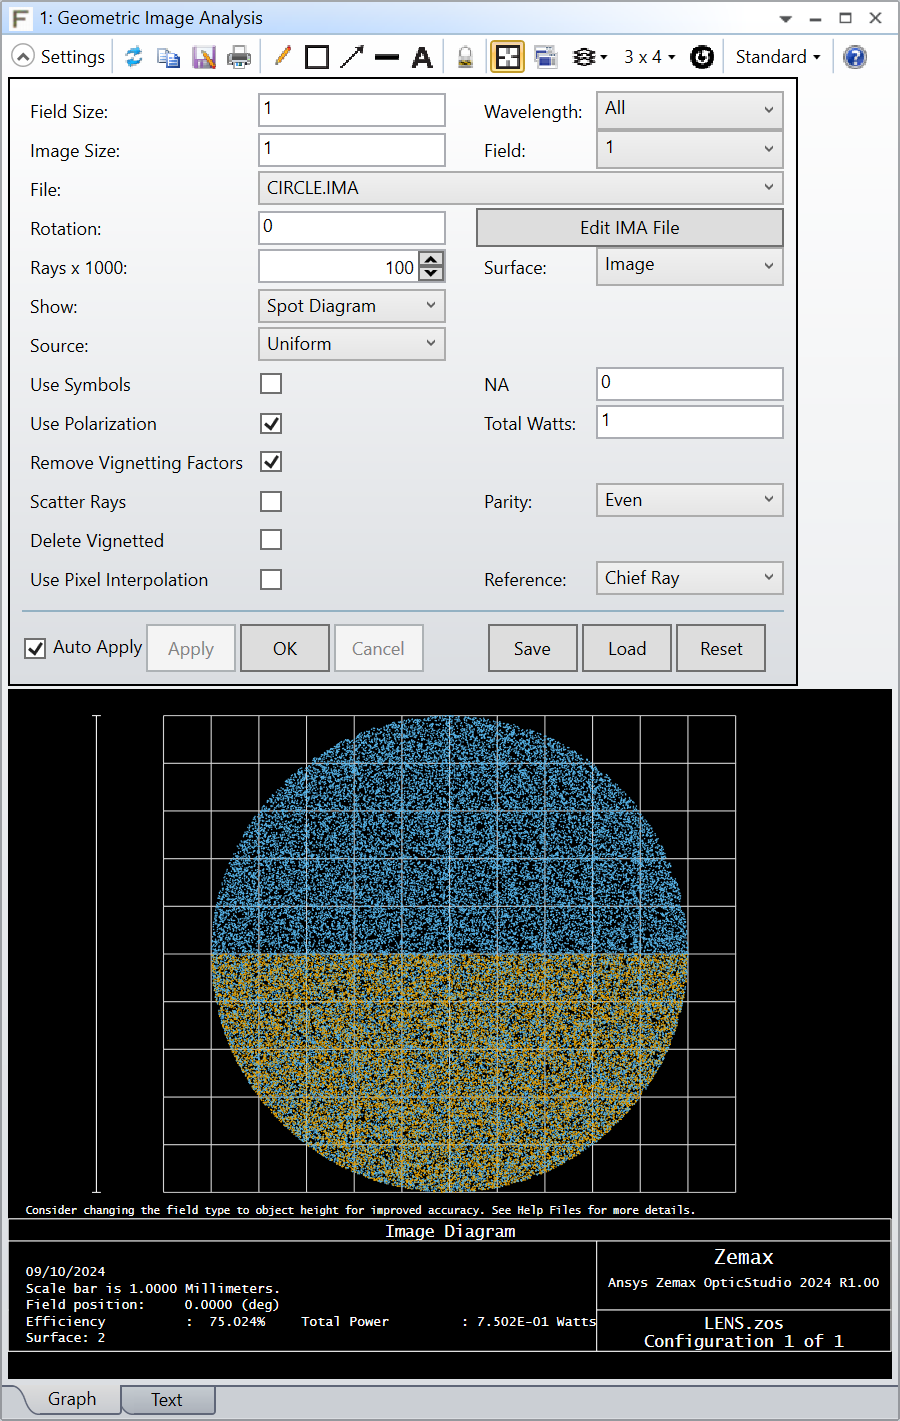
And using Analyze..Extended Scene Analysis..Geometric Image Analysis, I got:

Which is what you expect, I think. One thing you could try is create the spot diagram with the ZOS-API as described in Example 22, and only plot the rays with a sufficient out double intensity:

Let me know if that works for you (sorry I haven’t got the time to test it myself today 😣)

Take care,


David


Hi @David.Nguyen

 Thanks for your replying, and I checked the dll, it works well in Geometric Image Analysis.

And about the spot diagram is a still puzzle for me. I have tried the Example22 python code (since I am not so familiar with c or c++, and no develop environment )


Environment

python 3.10 64bit

PyCharm Community Edition 2022.1

Ansys Zemax OpticStudio 2024 R1.03


The error says, IAS has no field method


and checked the dir, there is no Field method in it. 

But in the help document, it shows 「ZOSAPI.Analysis.Settings.IAS_Field」 


I am wondering where the error happens, and c++ use a similar code, I wonder whether it works well.


Could you give me some suggestions?


Best regards

Yang


@Yang.Yongtao 


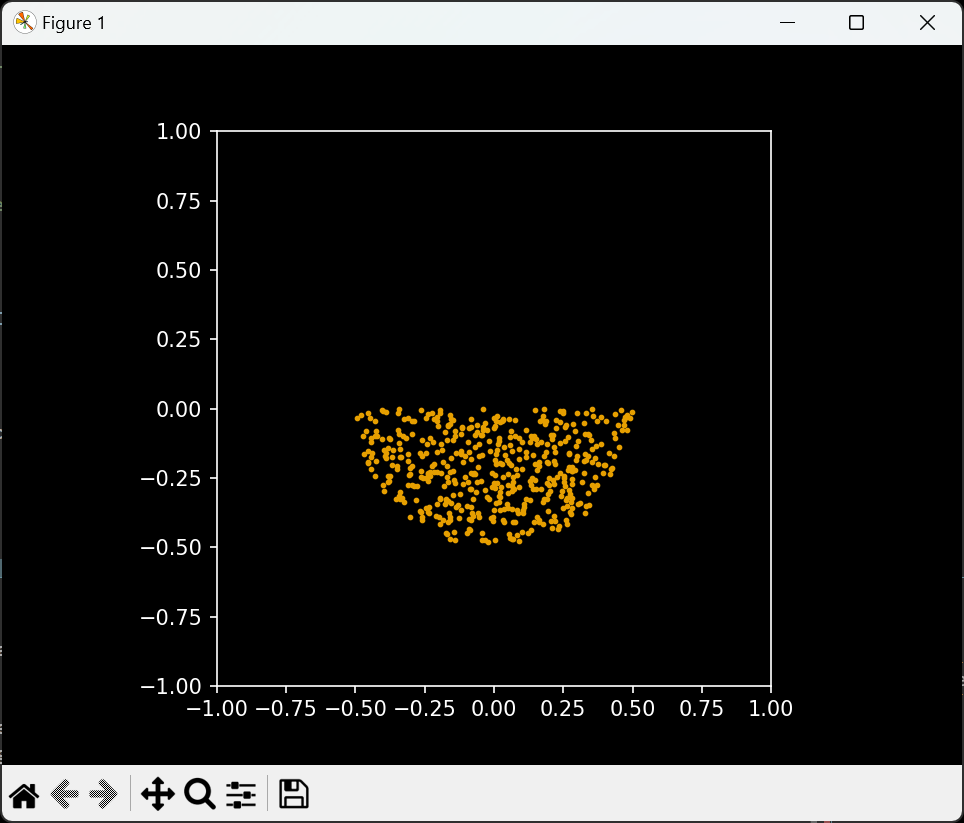
I’m not sure I understand your issue, but here’s a Python code that works for me in R1.00, Python 3.10, Pythonnet 3.0.3. Your version of PyCharm shouldn’t matter. It creates a spot diagram from the field Hx = 0, Hy = 0 at a specific wavelength wav_num. The number of spots is stored in the variable max_rays. Compared to Example 22, I sample rays from a circle (as opposed to a square). Also note that I’m not showing spots whose intensity is 0 (ray_datae-1]!=0).

from random import random
import matplotlib.pyplot as plt
import math

import clr, os, winreg
from itertools import islice
from System import Enum, Int32, Double

# This boilerplate requires the 'pythonnet' module.
# The following instructions are for installing the 'pythonnet' module via pip:
# 1. Ensure you are running a Python version compatible with PythonNET. Check the article "ZOS-API using Python.NET" or
# "Getting started with Python" in our knowledge base for more details.
# 2. Install 'pythonnet' from pip via a command prompt (type 'cmd' from the start menu or press Windows + R and type 'cmd' then enter)
#
# python -m pip install pythonnet

# determine the Zemax working directory
aKey = winreg.OpenKey(winreg.ConnectRegistry(None, winreg.HKEY_CURRENT_USER), r"Software\Zemax", 0, winreg.KEY_READ)
zemaxData = winreg.QueryValueEx(aKey, 'ZemaxRoot')
NetHelper = os.path.join(os.sep, zemaxData 0], r'ZOS-API\Libraries\ZOSAPI_NetHelper.dll')
winreg.CloseKey(aKey)

# add the NetHelper DLL for locating the OpticStudio install folder
clr.AddReference(NetHelper)
import ZOSAPI_NetHelper

pathToInstall = ''
# uncomment the following line to use a specific instance of the ZOS-API assemblies
#pathToInstall = r'C:\C:\Program Files\Zemax OpticStudio'

# connect to OpticStudio
success = ZOSAPI_NetHelper.ZOSAPI_Initializer.Initialize(pathToInstall);

zemaxDir = ''
if success:
zemaxDir = ZOSAPI_NetHelper.ZOSAPI_Initializer.GetZemaxDirectory();
print('Found OpticStudio at: %s' + zemaxDir);
else:
raise Exception('Cannot find OpticStudio')

# load the ZOS-API assemblies
clr.AddReference(os.path.join(os.sep, zemaxDir, r'ZOSAPI.dll'))
clr.AddReference(os.path.join(os.sep, zemaxDir, r'ZOSAPI_Interfaces.dll'))
import ZOSAPI

TheConnection = ZOSAPI.ZOSAPI_Connection()
if TheConnection is None:
raise Exception("Unable to intialize NET connection to ZOSAPI")

TheApplication = TheConnection.ConnectAsExtension(0)
if TheApplication is None:
raise Exception("Unable to acquire ZOSAPI application")

if TheApplication.IsValidLicenseForAPI == False:
raise Exception("License is not valid for ZOSAPI use. Make sure you have enabled 'Programming > Interactive Extension' from the OpticStudio GUI.")

TheSystem = TheApplication.PrimarySystem
if TheSystem is None:
raise Exception("Unable to acquire Primary system")

def reshape(data, x, y, transpose = False):
"""Converts a System.Doublet,] to a 2D list for plotting or post processing

Parameters
----------
data : System.Doublet,] data directly from ZOS-API
x : x width of new 2D list wuse var.GetLength(0) for dimension]
y : y width of new 2D list wuse var.GetLength(1) for dimension]
transpose : transposes data; needed for some multi-dimensional line series data

Returns
-------
res : 2D list; can be directly used with Matplotlib or converted to
a numpy array using numpy.asarray(res)
"""
if type(data) is not list:
data = list(data)
var_lst = vy] * x;
it = iter(data)
res = list(islice(it, i)) for i in var_lst]
if transpose:
return self.transpose(res);
return res

def transpose(data):
"""Transposes a 2D list (Python3.x or greater).

Useful for converting mutli-dimensional line series (i.e. FFT PSF)

Parameters
----------
data : Python native list (if using System.Datay,] object reshape first)

Returns
-------
res : transposed 2D list
"""
if type(data) is not list:
data = list(data)
return list(map(list, zip(*data)))

print('Connected to OpticStudio')

# The connection should now be ready to use. For example:
print('Serial #: ', TheApplication.SerialCode)

# Insert Code Here
max_rays = 1000
wav_num = 2
img_surf = TheSystem.LDE.NumberOfSurfaces

x_array = x]
y_array = y]

batch_raytrace_tool = TheSystem.Tools.OpenBatchRayTrace()

norm_unpol_raytrace = batch_raytrace_tool.CreateNormUnpol(max_rays, ZOSAPI.Tools.RayTrace.RaysType.Real, img_surf)
norm_unpol_raytrace.ClearData()

for ii in range(max_rays):
radius = random()**0.5
angle = random() * 2 * math.pi

px = radius * math.cos(angle)
py = radius * math.sin(angle)

norm_unpol_raytrace.AddRay(wav_num, 0, 0, px, py, Enum.Parse(ZOSAPI.Tools.RayTrace.OPDMode, "None"))

batch_raytrace_tool.RunAndWaitForCompletion()

norm_unpol_raytrace.StartReadingResults()

sysInt = Int32(1)
sysDbl = Double(1.0)

ray_data = norm_unpol_raytrace.ReadNextResult(sysInt, sysInt, sysInt,
sysDbl, sysDbl, sysDbl,
sysDbl, sysDbl)

while ray_datae0]:
if ray_dataf2]==0 and ray_datad3]==0 and ray_datad-1]!=0:
x_array.append(ray_datad4])
y_array.append(ray_datad5])

ray_data = norm_unpol_raytrace.ReadNextResult(sysInt, sysInt, sysInt,
sysDbl, sysDbl, sysDbl,
sysDbl, sysDbl)

batch_raytrace_tool.Close()

plt.style.use('dark_background')
plt.figure()
plt.scatter(x_array, y_array, c='#E69F00', s=3)
plt.xlim(-1, 1)
plt.ylim(-1, 1)
ax = plt.gca()
ax.set_aspect('equal')
plt.show()

I coded this quickly, there’s room for improvements, but hopefully that gets you started.

Take care,


David


Hi @David.Nguyen

 Thanks so much for your help !

  It works 


 Best regards


Yang


Reply