hi Community
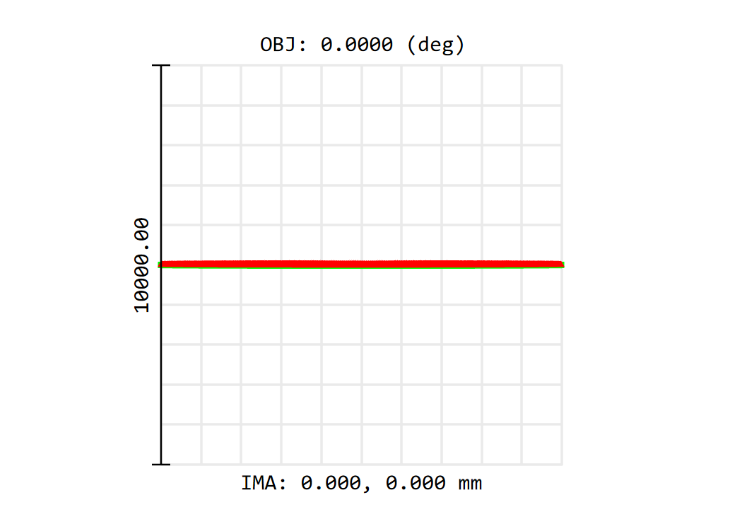
I am trying to set the grid(1000mmX1000mm) to a designed size, say 400mm X50mm
how can I make it? It seems that it always shows as square.
Thanks
hi Community
I am trying to set the grid(1000mmX1000mm) to a designed size, say 400mm X50mm
how can I make it? It seems that it always shows as square.
Thanks
Hi Yang,
There are not many display settings for the Spot Diagram. Two of them should be mentioned here, although I don’t know if they’ll fix your problem. First, you have the Plot Scale, which allows you to zoom in and out of the grid by changing the size of the scale bar (the grid remains square though). Then, if you click and drag somewhere in the diagram, you can draw a rectangle around a region of interest and OpticStudio will zoom inside it.
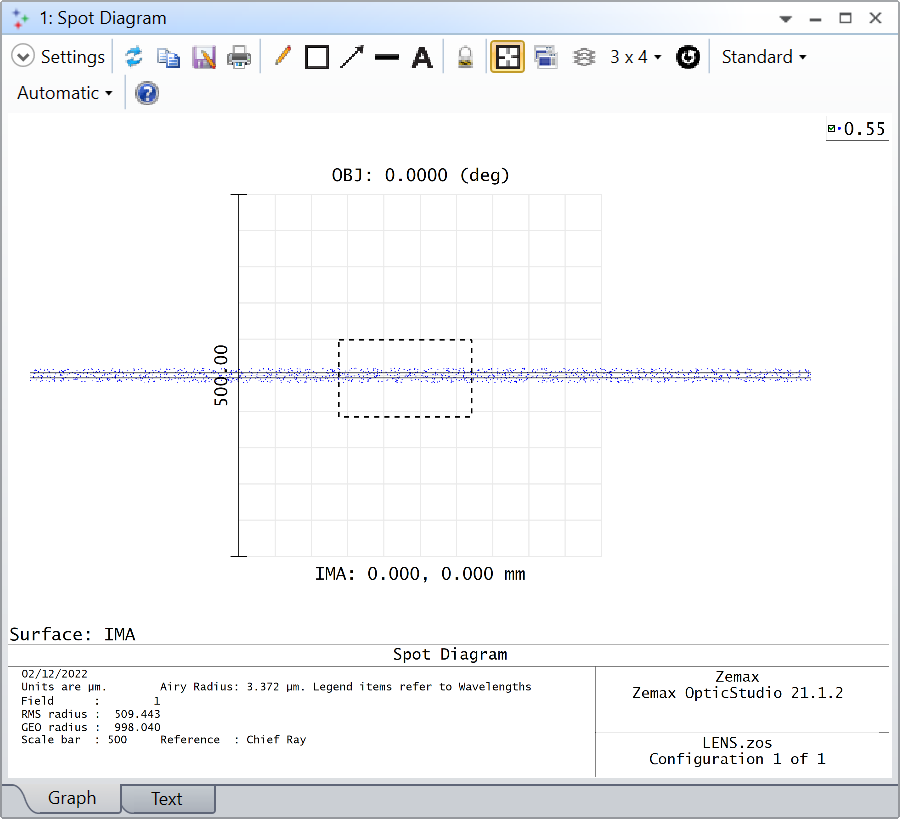
However, the shape of that region of interest has to be a rectangle with fixed proportions.
If you need to display a custom part of the spot diagram, I suggest using the ZOS-API. Its a bit more work, but the idea is that you trace your rays and select which ones you want to include in your analysis. Example 22 of the ZOS-API Syntax Help shows how to reproduce the Spot Diagram via ray tracing, and if you use it with Python or MATLAB, you can have much more freedom over your display settings. Let me know if you need more help with that (and consider sharing an example of what you’d want).
Take care,
David
Hi David
Thanks for your reply.
Pity that the first method you mentioned did not fix my problem. sorry for unclear question, actually what I wanted to do is show the diagram as the same size as real sensor size.
Is it possible to make it?
The second method, I trying to read the code, a little difficult for me to understand….
Thanks very much!
Yang
Hi Yang,
Have you tried converting your file to non-sequential mode? In there you could use a Detector Rectangle, with whatever rectangular shape and pixel size you like. Here is a dummy example:
The detector size is 2.0 x 0.5 mm^2 and the pixels are 15.6 x 15.6 um^2. In Non-Sequential detectors, you don’t view the ray landing coordinates like in a spot diagram. Instead, the Power of the source is split between the rays and every pixel is a sum of the individual ray contribution to that particular pixel.
I hope this helps.
Take care,,
David
Enter your E-mail address. We'll send you an e-mail with instructions to reset your password.