The acceptance NA for a fiber is found by the expression NA = Sqrt(n1^2-n2^2), and the arcsin of this is the acceptance angle. Yet, I am finding a small number of rays are clearly entering the fiber. I am using a multi-mode fiber model in non-sequential explicitly constructed with concentric glass tubes. What is happening here?

Solved
How rays enter a multimode fiber at larger acceptance angles
 +1
+1Best answer by Kevin Scales
For meridional rays that pass through the optic axis, the expression for NA is correct. There is a hard limit to which rays will pass through and which will leak out. For skew rays, however, there is a more complicated physics going on. Rays that do not pass through the optic axis will refract on entering the fiber core in the same way according to Snell’s law, but their first intersection with the core-cladding interface will be at a shallower angle, and so some of these rays will undergo total internal reflection (TIR) just like meridional rays with a lower input angle. Such rays will follow a helical path, and the further away from the axis the ray begins, the larger the number of accepted ray angles becomes. The situation is best shown in the figure below, with blue rays being a fan of skew rays and green showing a fan of meridional, all tilted at ten degrees, just outside the acceptance angle for the fiber. For simplicity, the outer face of the cladding is set to ABSORB so lost rays are quickly removed.
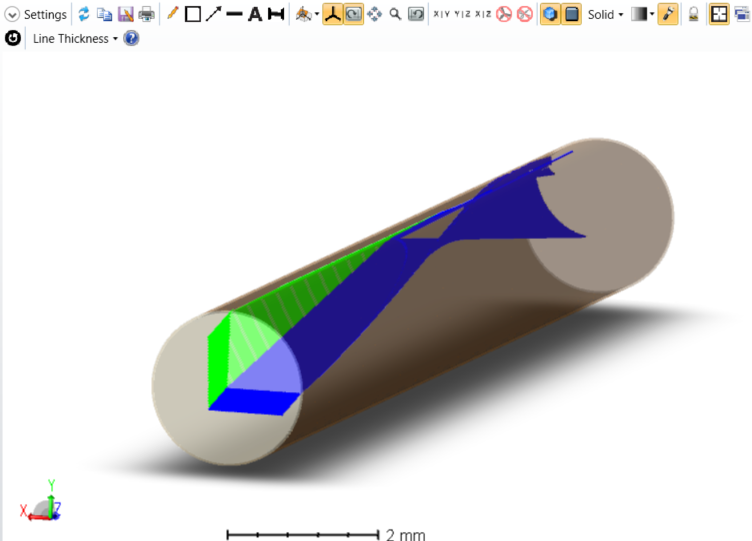
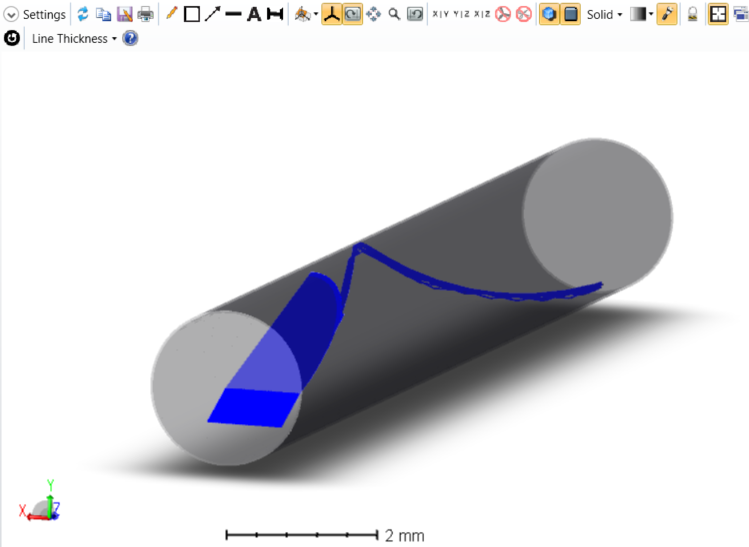
The green meridional rays all leave the core and are lost, while most of the skew rays remain, following a helical path. Only a few near the optic axis do not couple into the fiber. If we increase the angle from ten to twenty degrees (and removing the meridional, to clean up the image), we see greater losses, as well as a tighter helical structure.
For any given fiber and input, we can plot the throughput as a function of input angle using the Universal Plot and a few operands in the merit function to initiate a trace and record the power. We can see a representative plot here. The losses increase rapidly past the nominal acceptance angle but remain positive up to ninety degrees as skew rays very close to the edge continue to show TIR.
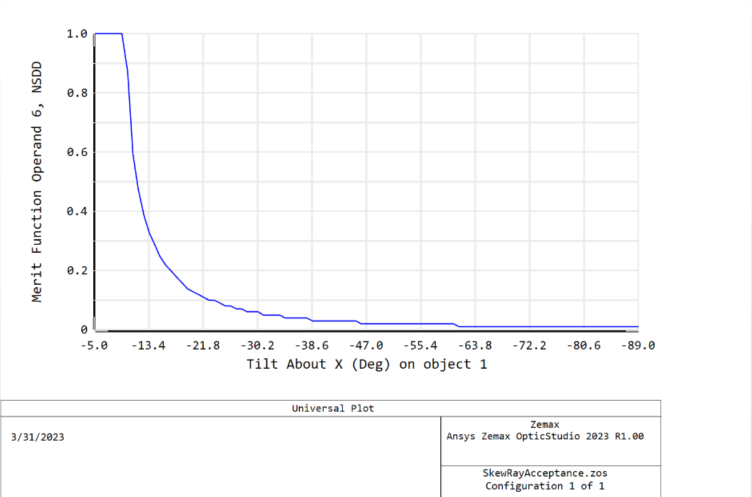
The sample file used for these graphs is attached.
Enter your E-mail address. We'll send you an e-mail with instructions to reset your password.
Need more help?
To Chinese users:
Do not provide any information or data that is restricted by applicable law, including by the People’s Republic of China’s Cybersecurity and Data Security Laws ( e.g., Important Data, National Core Data, etc.).
不要提供任何受适用法律,包括中华人民共和国的网络安全和数据安全法限制的信息或数据(如重要数据、国家核心数据等)。