Solved

How does OpticStudio determine the grid over which the FFT PSF is calculated?

  • June 2, 2025
  • 6 replies
  • 161 views

chaasjes
Forum|alt.badge.img

Hello,

I am currently trying to understand the sampling behavior of the FFT PSF analysis in OpticStudio. The analysis has two sampling parameters:

  1. ‘Sampling’, hereafter referred to as S, documented as “The size of the ray grid used to sample the pupil”.
  2. ‘Display’, hereafter referred to as D, documented as “The display size indicates what portion of the computed data will be drawn when a graphic display is generated. The display grid can be any size from 32 x 32 up to twice the sampling grid size. Smaller display sizes will show less data, but at higher magnification for better visibility”.

Based on implementations described in the literature and basic tests with OpticStudio, I assumed the PSF calculation works like this:

  1. Sample the wavefront at the pupil with a sampling S;
  2. Zero-pad the wavefront to the maximum possible display sampling Dmax;
  3. Crop the result to a size D. This last step was inferred from OpticStudio’s output.

Based on the properties of the Fourier transform, I assume the following behavior when changing the sampling parameters:

  1. Increasing the pupil sampling S increases the extent of the PSF. For example, if the extent of the PSF is 10 μm with S = 32x32, it will double to 20 μm when S is doubled to 64x64.
  2. Increasing the display sampling D while keeping S the same will increase the PSF resolution, i.e. the spacing dx between two adjacent points in the PSF will decrease.

In OpticStudio, the PSF resolution depends on the ratio D / S. D has to be in the range [S, 2S] and choosing D < 2S appears to crop or zoom the PSF, so OpticStudio does not allow to adjust the ratio D / S. As a result, assumption 2 cannot be tested by increasing D, but we can test assumption 1. I performed this test on the ‘Cooke 40 degree field’ sample.

Let’s start with S = 64x64, D = 128x128:

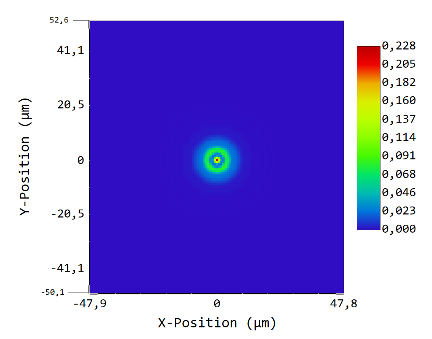
dx = 0.818 μm, data area is 104.759 μm wide.

Now decrease D to 64x64:

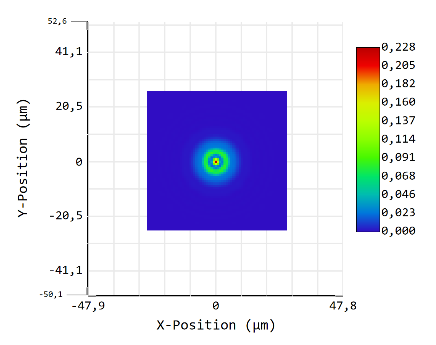
This indeed only crops the PSF. dx remains the same.

Now increase S to 128x128 and D to 256x256. D / S remains the same, so the extent should not change, but S is doubled, so dx should be halved. Result:

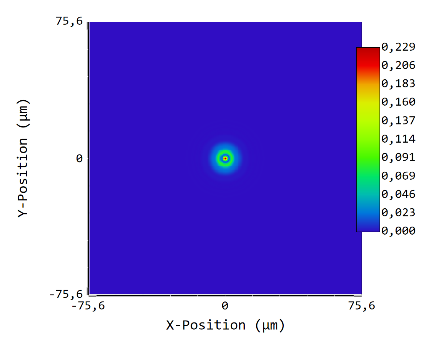
dx = 0.588 μm, data area is 150.541 μm wide. dx is not halved, so assumption 1 is not true; furthermore, the PSF extent changed, so assumption 2 is also not true.

I think this means I wrongly assumed D is the size of the grid over which the PSF is calculated. My question is: how, then, does OpticStudio choose the size of the grid over which the PSF is calculated, and (how) does this relate to the ‘Display’ sampling D?

I see a few options:

  1. OpticStudio has a hardcoded relation between the pupil sampling S and the PSF grid size D’. It then finds the bounds where the PSF becomes almost zero, crops it to these bounds, and resamples the result to the display grid size D.
  2. OpticStudio somehow calculates which PSF grid size D’ to use such that the PSF reaches 0 at a grid size of 2S. It then crops the PSF to the selected display grid size D, without resampling. I expect this to be inefficient because it may require multiple PSF calculations, but maybe there’s a smart way to predict the required value of D’ without calculating the PSF twice.

Curious to hear if anybody here knows how this works!

Best answer by Sean Turner

Have you checked the FFT PSF part of the manual? There is a large section about how sampling works. 

6 replies

chaasjes
Forum|alt.badge.img
  • Author
  • Visible
  • 38 replies
  • June 2, 2025

Sorry, the forums do not allow me to submit the actual question, without giving a (clear) error message. I am trying to still get it in the first post using the edit function.

Edit: for some reason, the screenshots were initially not accepted. The full post is available now.


Sean Turner
Fully Spectral
Forum|alt.badge.img+1
  • Fully Spectral
  • 106 replies
  • Answer
  • June 3, 2025

Have you checked the FFT PSF part of the manual? There is a large section about how sampling works. 


chaasjes
Forum|alt.badge.img
  • Author
  • Visible
  • 38 replies
  • June 4, 2025

Yes, I did check the FFT PSF page in the manual, but must have overlooked the sampling part. The manual indeed answers my question. Thanks!


jmcschmidt
  • Single Emitter
  • 2 replies
  • November 6, 2025

The FFT PSF part of the manual is pretty clear about how Zemax computes the grid spacing in the image plane.  When I compute the grid spacing using their equations, I get the same value they specify.  However, I am unclear on where the origin is on their grid.  For a standard 2-D FFT of an array with NxN samples, the origin is at (N/2+1,N/2+1).  This would be for both the pupil and image planes.  When I run a FFT PSF calculation in the Zemax GUI with Sampling = 128x128 and Display = 256x256, the text tab says “Center point is: row 129, column 128”.  This matches N/2+1 for the row, but not the column.  When I run this calculation using the ZOS-API in Matlab and extract the PSF, the peak value of the PSF (a case with azimuthally symmetric aberration) is at row 129, column 128, so that agrees with what the GUI says about the center point.  However, x = 0 at grid point 128, and y = 0 at grid point 128, which is inconsistent.  Further, I do not understand what grid is used in pupil plane to produce an image plane grid with its origin at (N/2+1,N/2+1).  Maybe I’m missing some subtlety about FFT grids, though.  If I understand the grid, I should be able to reproduce their PSF results to machine precision, but I cannot, yet.


MichaelH
Ansys Staff
Forum|alt.badge.img+2
  • Ansys Staff
  • 411 replies
  • November 14, 2025

Hi Jason,

First, the FFT PSF grid is calculated in the normalized pupil plane, so all coordinates are unitless. 

Next, in order to “properly” calculate a Fast Fourier Transform, the sample grid should be in the form of 2^n power, so when you have a grid of 128x128, there is no “center” pixel since the grid is even.  OpticStudio typically picks n/2+1, but this choice is arbitrary and for the FFT PSF, the center pixel for the column (x-coordinate) is n/2 rather than n/2 + 1.  OpticStudio could have easily chosen n/2 + 1 for both the row and the column as the center point and the calculation would not change.

The peak “centroid” of the PSF intensity has nothing to do with the grid location.  The grid is determined before the FFT is performed and for “well behaved” systems, the centroid happens to coincide with the central pixel; this is not guaranteed for systems with a large amount of aberration.

If you need to get the XYZ location of the PSF spot in “real” image plane coordinates, then you should use the Huygens PSF rather than the FFT PSF.  Since the FFT PSF is measured in the pupil plane, the size of the grid on the image plane can be calculated but the location on the image plane cannot be calculated; there are no XY position with respect to the center of the image plane.  With the Huygens PSF, you have 3 “center” values calculated:

  • Center Coordinates: location of center of the grid w.r.t. to the image plane
  • Centroid Offset: PSF centroid location w.r.t. the center of the data grid
  • Centroid Coordinates: PSF centroid location w.r.t. to the image plane

jmcschmidt
  • Single Emitter
  • 2 replies
  • November 14, 2025

Hi @MichaelH,

Thanks for your explanation.  I still have a few points of disagreement/confusion about this:

  1. When you say “proper” FFT, I think you are referring to the Cooley-Tukey algorithm, which is specifically for grid sizes that are powers of 2.  There are many other FFT algorithms for other grid sizes that are very fast.  If Zemax OpticStudio wants to restrict the FFT PSF calculation to powers of 2, that’s fine.  In that case, Zemax’s grid size is always even, like you said.
  2. When I run the FTT PSF using the Matlab ZOS-API, the origin of the x and y coordinates of the image plane are both at the n/2 pixel.  In my case, the SampleSize property in the PSF settings is set to ZOSAPI.Analysis.Settings.Psf.PsfSampling.PsfS_128x128, and the OutputSize is set to ZOSAPI.Analysis.Settings.Psf.PsfSampling.PsfS_256x256.  The origin is at (128,128).  Also, I have run the FFT PSF in the OpticStudio GUI on the same .zmx file (same field angle, same wavelength) and set Sampling to 128x128 and the Display to 256x256.  The two PSFs look similar in plots, and their image-plane grid spacings are the same, but the PSF values are not identical.  In fact, Text tab says the pupil grid size is 128, the image grid size is 256, and the center point is row 129, column 128.  This tells me that the GUI and ZOS-API are using different settings or maybe different algorithms altogether.
  3. In Matlab, I take the Standard Zernike Coefficients, sum the weighted Zernike polynomials, compute the pupil-plane field, then Fourier transform it to the image plane, and take the magnitude squared to compute the PSF (normalized by the peak of the aberration-free PSF).  I compare this to the FFT PSF result computed by the ZOS-API.  I can get the peak values to agree in the first two digits, but if I get the pupil plane grid right, I think I should be able to get them to agree to floating-point precision.  I think it is critical to understand the pupil-plane grid that Zemax uses.
  4. I agree that shifting the pupil in x-y (i.e., its origin) should not affect the location of the peak in the PSF.  The Fourier shift theorem says that a shift in the pupil plane only results in a linear phase in the image plane, which does not affect the PSF because it is the magnitude squared.  In the aberration-free case (maybe “well behaved”, as you put it), the peak will always be at the (n/2+1,n/2+1) pixel.  I’ve tested this, just to be sure.  Using the Fourier shift theorem in reverse, if you want to shift the peak of PSF to another pixel, you have to add a tilt phase in the pupil plane.  The amount of tilt depends on how far you want to shift the PSF.  Shifting from n/2+1 to n/2 only requires a small tilt.
  5. I am unclear about your statement that the location on the image plane cannot be calculated.  Both the OpticStudio GUI and ZOS API compute spatial grids for the image plane in physical units, e.g., microns.  The discrete Fourier transform is normalized (and uses normalized coordinates), and Zernike polynomials are written as function of normalized pupil coordinates, but alongside the FFT, you can keep track of spatial coordinates by using the pupil size to scale the pupil grid spacing and total grid size to physical units.  Then, the frequency grid spacing is the reciprocal of the total grid size of the physical pupil-plane grid.  These spatial frequencies map to spatial coordinates in the image plane.  The image-plane coordinates are equal to the spatial frequencies multiplied by the effective focal length and wavelength.  The OpticStudio documentation on the FFT PSF sort of says this in its explanation of the image-plane grid spacing, too.
  6. Can you explain the differences between the image-plane origin in the OpticStudio GUI and the ZOS-API?  Can you explain how either of them shifts the peak of the PSF (in well-behaved cases) from the n/2+1 pixel to n/2?  It seems like there must be a tilt added in the pupil plane prior to computing the FFT.