I am running fluorescence simulations on a liquid test sample, with a custom detector object. I am currently modelling fluorescence using Volume Physics Tab-> Phosphors and Fluorescence Radio Button -> Standard model (No Mie Scattering). I need to vary the particle density over a range, and save the power at the detector as a function of the particle density. How could I vary the particle density as well as uncheck mie scattering using a macro?


Also, is there a way to visualize the detector data for a custom object made to be a detector?


Thanks,


Aditi


Hi Aditi,


These parameters aren't available in macros to the best of my knowledge. However, they are through the ZOS-API.


I'm attaching a MATLAB live script that demonstrates their use.


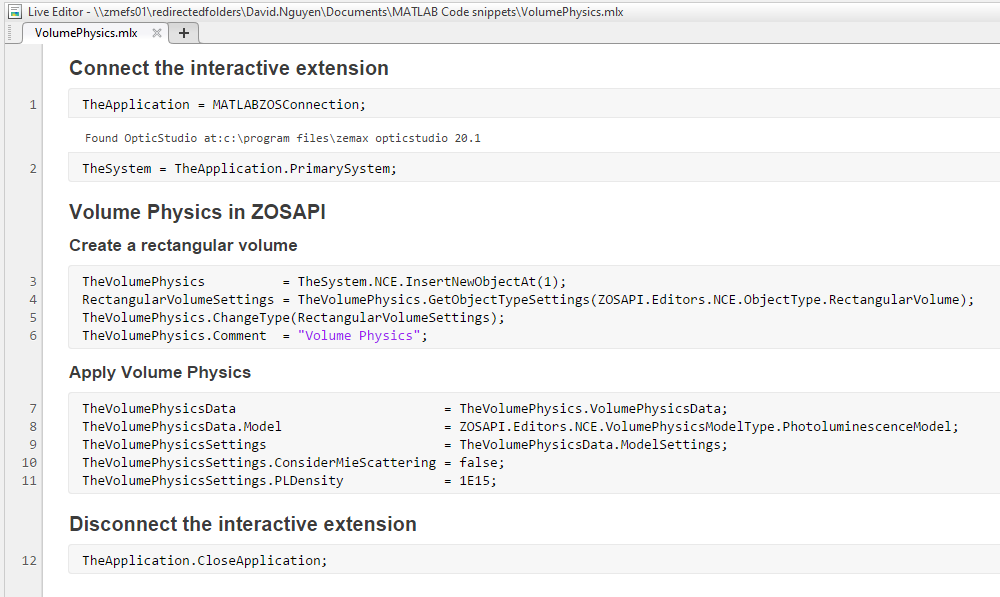
The script looks as follow:


The file MATLABZOSConnection in line 1 can be generated by pressing Programming tab...MATLAB...Interactive Extension. After you've pressed the Programming tab...Interactive Extension button, you can run this live script from the same folder as the connection file.


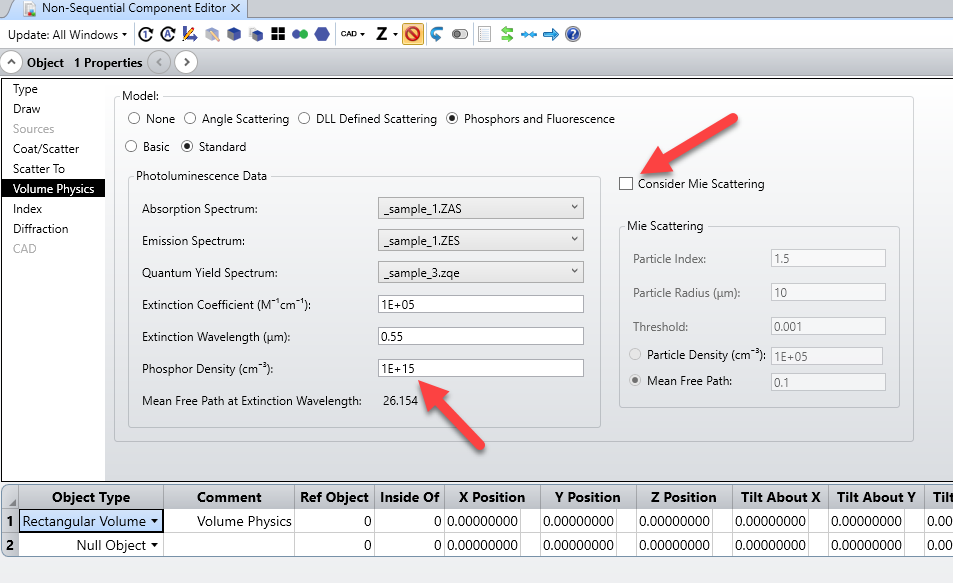
It will create a new rectangular volume in your non-sequential file with the following settings:


As for your other question, I'm attaching an example where I display the irradiance of a detector object (a cylindrical lens) in the NSC Shaded Model using the settings Detector: Color pixels by last analysis.


Let me know if that's the kind of visualization you had in mind.


Kind regards,


David
Hi David,


Thanks for your reply!


I already have a lens file which I want to carry out the analysis in. Unfortunately, I am unable to load the .ZMX file and access its objects it using ZOS-API. Do you have any suggestion for that? Thanks!


Hi Aditi,


It's my pleasure.


What problem do you encounter when trying to use the ZOS-API? Is there a specific error message that is displayed? Are you also trying with MATLAB, or are you using a different programming language?


I suggest you to have a look at our Getting started with ZOS-API learning path at


https://my.zemax.com/en-US/learning-paths/


Additionally, if you press Programming Tab...ZOS-API Help...ZOS-API Syntax Help, you'll be prompted with the ZOS-API help file, which contains a list of examples. I suggest to have a look at example 8 in your particular case.


Let me know if this helps.


Kind regards,


David


Hi David,


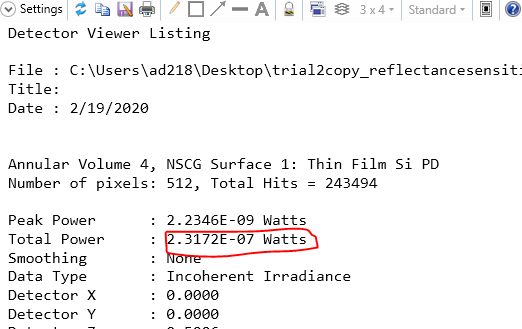
I found my mistakes and was able to run a ZOS-API to run the ray trace! However, the power at the detector that I get from the text tab of detector viewer (~230 uW), when I run the analysis, is much lower than when I try to GetDetectorData using ZOS-API (~270 uW).


For the Matlab ZOS-API, my command is:


[success, detectorData] = TheNCE.GetDetectorData(4,0,0);


display(detectorData);


Here's what I get when I run a raytrace in Zemax and then get the solution in the text tab if detector viewer:


Total power: 231.72 E-7 Watts


Is this because I am using a custom detector object, which I have to call out as 'Object is a detector'? How can I fix this difference in the results?


Thanks,


Aditi


capture.png

Reply