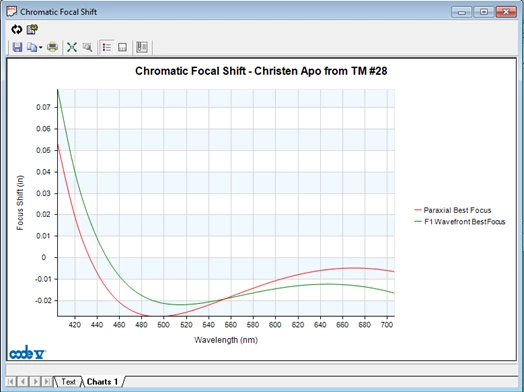
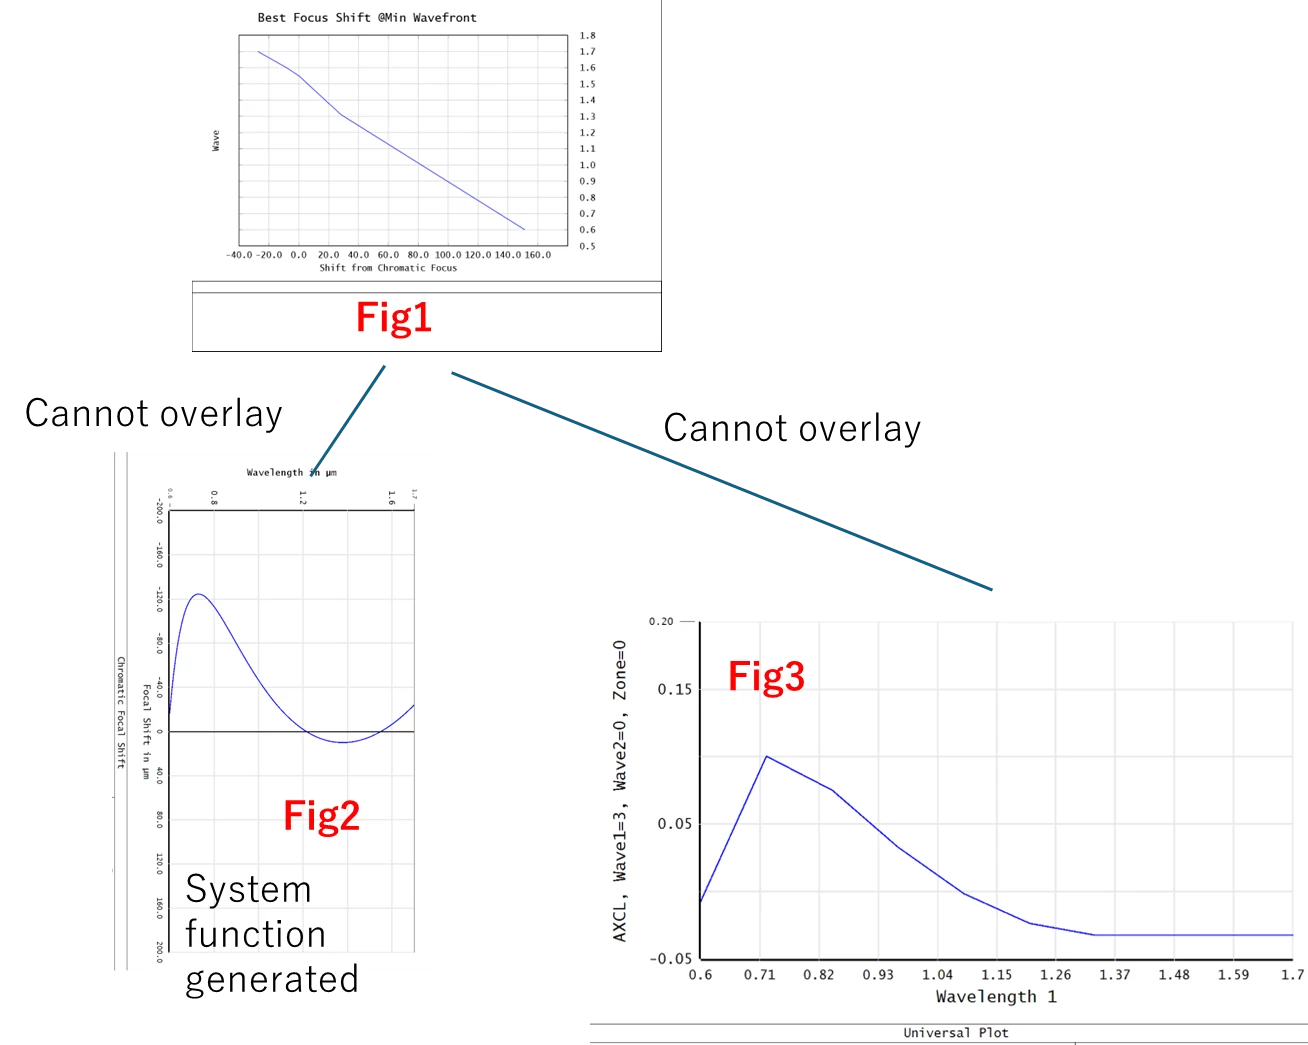
Try this. It does what CodeV does, but the graphics are 1980-quality. Better to export array values to Excel where you can actually make decent looking plots.
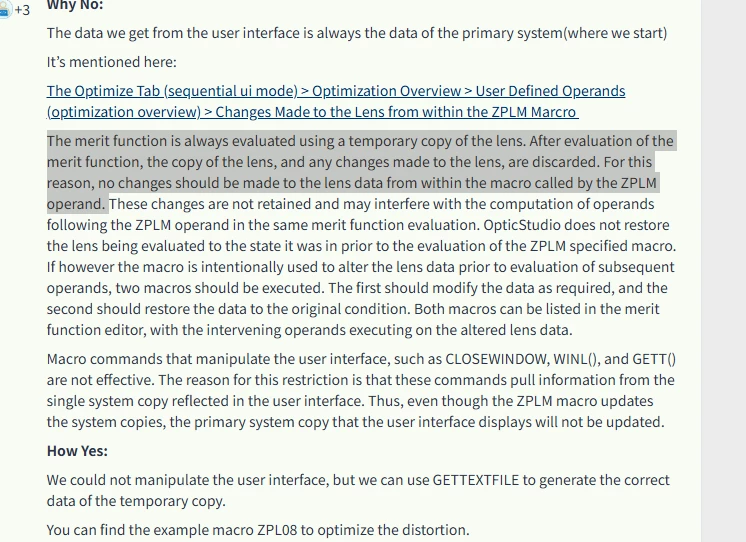
Just my style: As you see, I always copy pertinent parts of the manual to my ZPL code so I don’t have to keep going back and forth.
Mike
==========================
# CHROMATIC_SHIFT.ZPL
OUTPUT SCREEN
PRINT
# STORE WAVELENGTHS FROM ORIGINAL SYSTEM:
numwav = NWAV()
DECLARE wvlns, DOUBLE, 1, numwav
DECLARE wvwgt, DOUBLE, 1, numwav
primwave = PWAV()
FOR jwv,1,NWAV(),1
wvlns(jwv) = WAVL(jwv)
wvwgt(jwv) = WWGT(jwv)
NEXT jwv
bflsurf = THIC(NSUR() - 1)
BFL = THIC(4)
# SET UP FOR ONE WAVELENGTH SCAN:
# SETSYSTEMPROPERTY code, value1, value2
# 200 Primary wavelength number
# 201 Number of wavelengths
# 202 Value 1 = wavelength number, Value 2 = wavelength in micrometers
# 203 Value 1 = wavelength number, Value 2 = wavelength weight
SETSYSTEMPROPERTY 200, 1 # Primary wavelength number will be 1
SETSYSTEMPROPERTY 201, 1 # One wavelength
SETSYSTEMPROPERTY 203, 1, 1 # Value1 = wavelength number, Value 2 = wavelength weight
UPDATE EDITORS
nwaves = 51
DECLARE RMS_spot, DOUBLE, 1, nwaves
DECLARE RMS_OPD , DOUBLE, 1, nwaves
DECLARE waves , DOUBLE, 1, nwaves
qw1 = 0.44
qw2 = 0.70
wvinc = (qw2 - qw1) / (nwaves - 1)
qw = qw1
FOR jwv,1,nwaves,1
waves(jwv) = qw
qw = qw + wvinc
NEXT jwv
# QUICKFOCUS mode, centroid
# mode 0 = RMS spot radius
# mode 1 = spot x
# mode 2 = spot y
# mode 3 = wavefront OPD
# centroid 0 = chief ray
# centroid 1 = image centroid
FOR jwv,1,nwaves,1
SETSYSTEMPROPERTY 202, 1, waves(jwv)
UPDATE EDITORS
QUICKFOCUS 1, 1
RMS_spot(jwv) = THIC(4)
QUICKFOCUS 3, 1
RMS_OPD(jwv) = THIC(4)
# FORMAT 3.0
# PRINT jwv,
# FORMAT 12.5
# PRINT waves(jwv), RMS_spot(jwv), RMS_OPD(jwv)
NEXT jwv
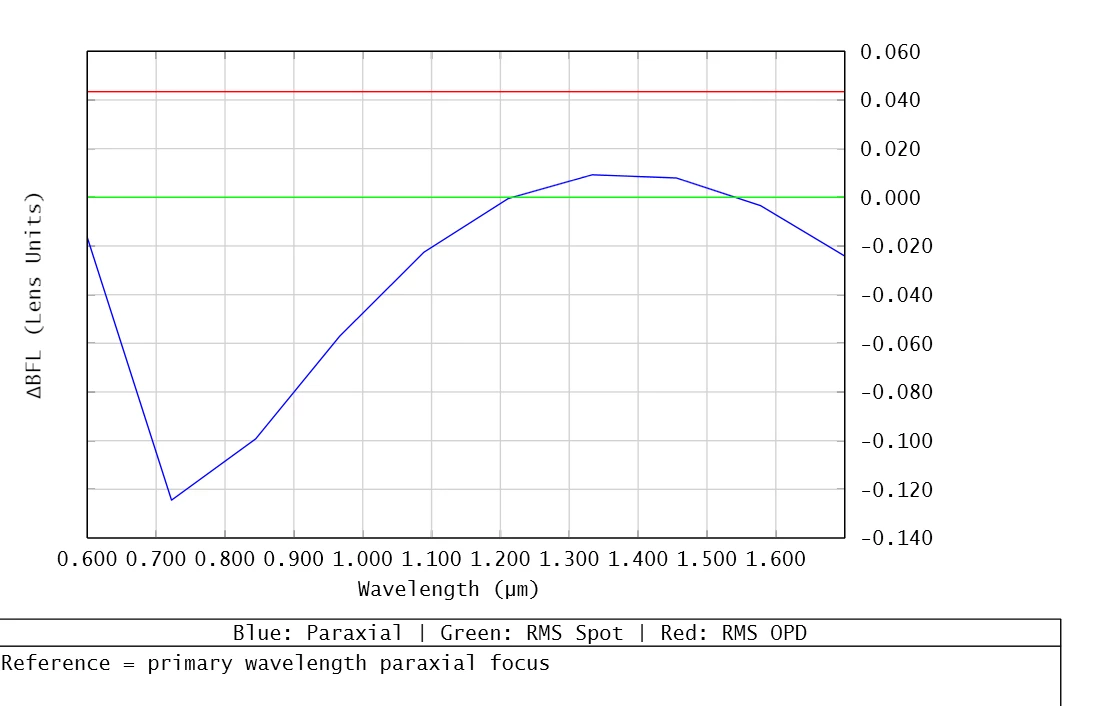
PLOT NEW
PLOT TITLE, "BFL vs Wavelength"
PLOT TITLEX, "Wavelength in µm"
PLOT TITLEY, "Back Focal Length in mm."
PLOT BANNER, "RMS Spot vs. RMS OPD"
#PLOT WINASPECT, type
PLOT COMM1, "Best focus RMS Spot in BLUE"
PLOT COMM2, "Best focus RMS OPD in GREEN"
#PLOT COMM3, string
#PLOT COMM4, string
#PLOT COMM5, string
#PLOT COMM6, string
PLOT RANGEX, qw1, qw2
#PLOT RANGEY, miny, maxy
#PLOT CHECK, x_increment, y_increment
#PLOT TICK, x_increment, y_increment
#PLOT FORMATX, with "%M.nf", M=total number of spaces, n=number of figures after the decimal point
PLOT FORMATX, "%5.2f"
#PLOT FORMATY, with "%M.nf", M=total number of spaces, n=number of figures after the decimal point
PLOT FORMATY, "%8.2f"
# PLOT DATA, x_array, y_array , no. points, color, style, options
PLOT DATA, waves, RMS_spot, nwaves, 1 # , style, options
PLOT DATA, waves, RMS_OPD , nwaves, 2 # , style, options
#PLOT LINE, x1, y1, x2, y2
#PLOT LABEL, x, y, angle, size, string
PLOT GO
# RESTORE WAVELENGTHS, BFL TO ORIGINAL SYSTEM:
SETSYSTEMPROPERTY 200, primwave # 200 Primary wavelength number
SETSYSTEMPROPERTY 201, numwav # 201 Number of wavelengths
FOR jwv,1,NWAV(),1
SETSYSTEMPROPERTY 202, jwv, wvlns(jwv) # 202 Value 1 = wavelength number, Value 2 = wavelength in micrometers
SETSYSTEMPROPERTY 203, jwv, wvwgt(jwv) # 203 Value 1 = wavelength number, Value 2 = wavelength weight
NEXT jwv
# SETSURFACEPROPERTY surface, code, value1, value2
SETSURFACEPROPERTY 4, 3, BFL
UPDATE ALL
END