Hi,
I have a question on the relation between GEO radius in spot diagram and radius for enclosed energy. I would like to couple a fiber to my beam and would like to understand the size of the fiber to choose and its acceptance angle.
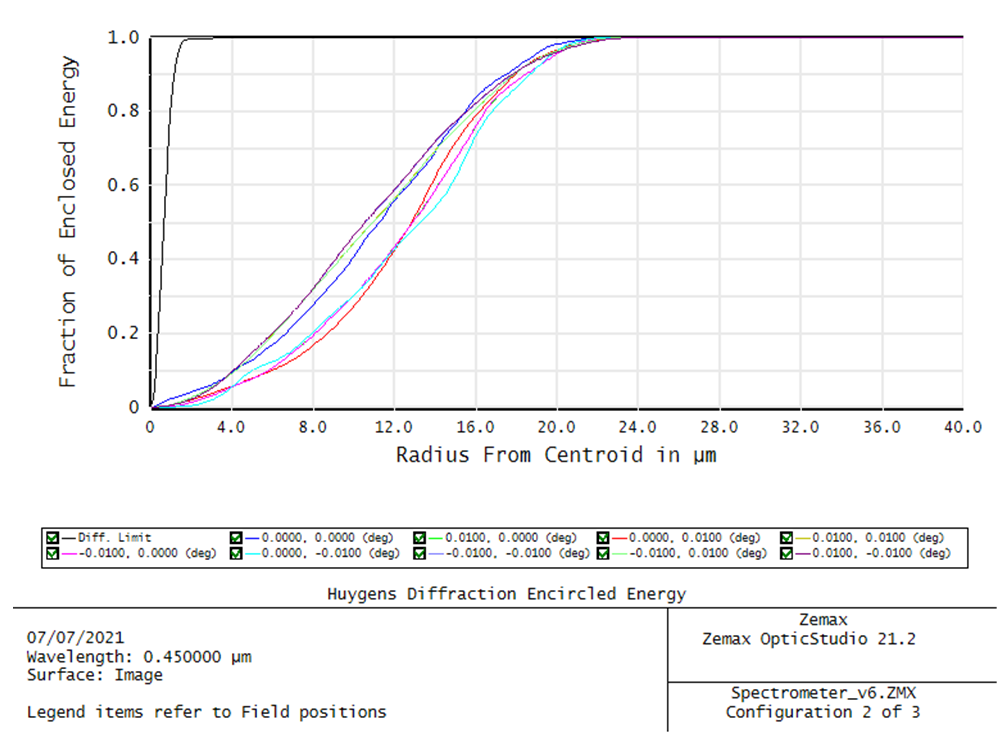
If I look at the 86% enclosed energy, using Huygens PSF, it is about 17um radius. Therefore I thought the MFD is 2x17um=34um which sets the limit of roughly 30um on the fiber core size.
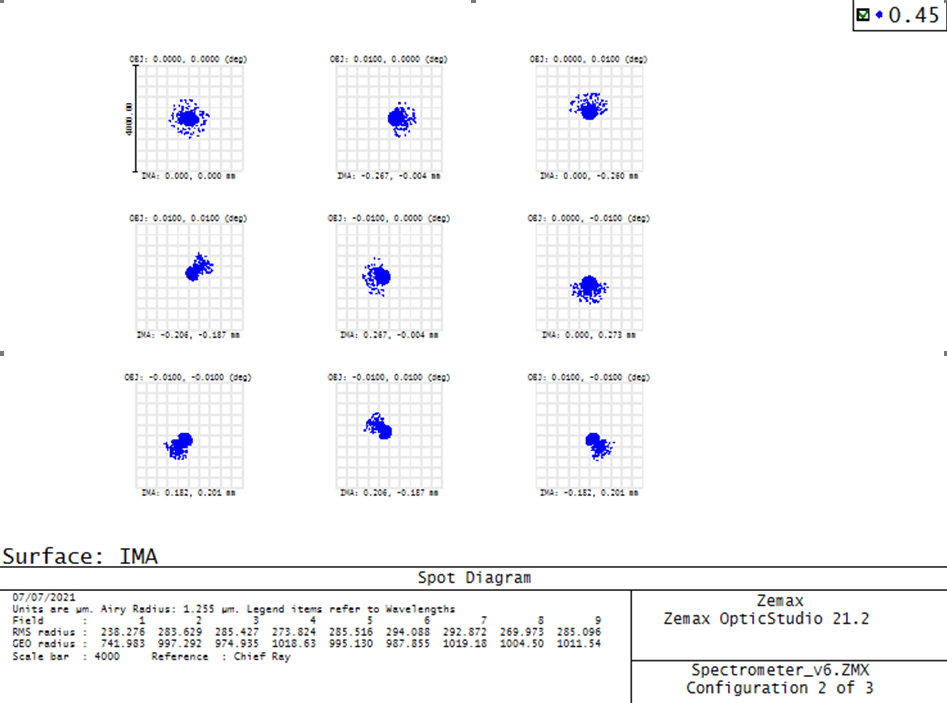
However, if I look at the spot diagram the GEO radius is about 1mm. Meaning, I need 2mm fiber size to cover all the beam to my understanding. This is far above 30um size which made me very confuse.
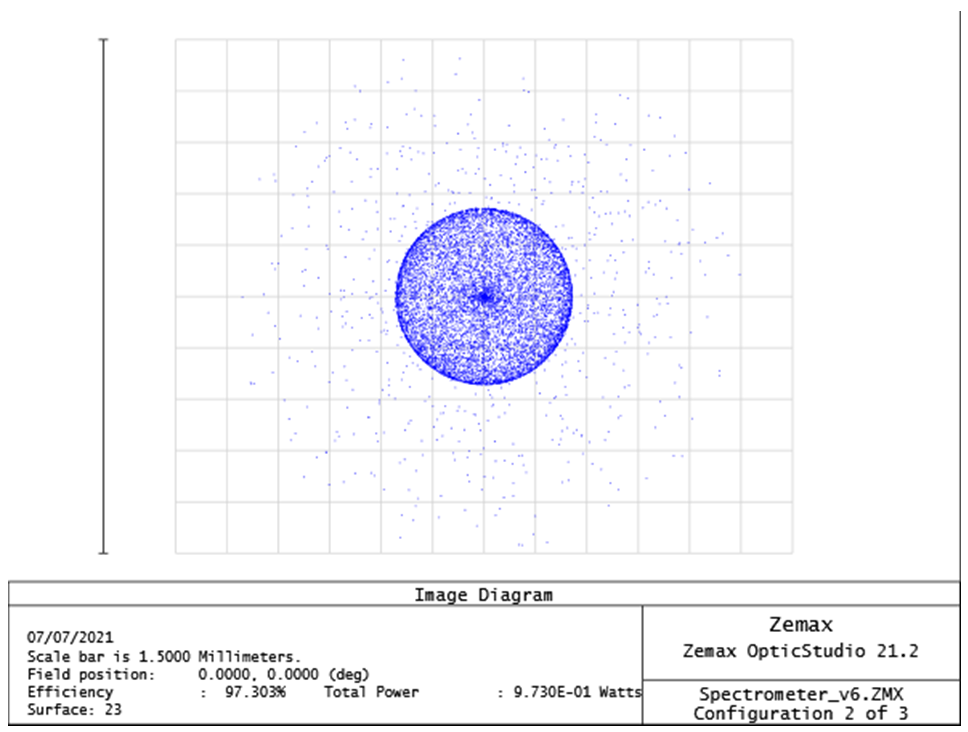
I checked geometrical image analysis. For 1.5mm image size, 97% of the total power included. For 34um image size, the efficiency is only 2%. Also when I look at the Fiber coupling option of MMF, the coupling efficiency is max 1.6%. I am not sure what fiber size it assumes to calculate the fiber coupling efficiency as I only selected 0.5 NA as the input. Also there is no difference for the coupling efficiency output for SMF or MMF selection in the tool, which I donot understand.
I am coming to the conclusion of using 1.5mm core size, but I donot understand the 34um diameter for 86% enclosed energy.
In regards to
When I am looking at the afocal image on the spot diagram, it is about 7degrees. This is the divergence of the beam, but does that mean the fiber input acceptance angle is 7degrees? I am not sure I understand it and how to limit it to only accept 0.01degrees.
Lastly, to incorporate coupled fiber do I have to switch to non-sequential mode?
I would highly appreciate your help.
Best regards,
Fatemeh