Field Profile (POP) Not Matching with Experiment

  • 29 December 2021
  • 11 replies
  • 483 views

Hello Reader, 

I’m a beginner in using Zemax and would appreciate assistance to resolve an issue of the field
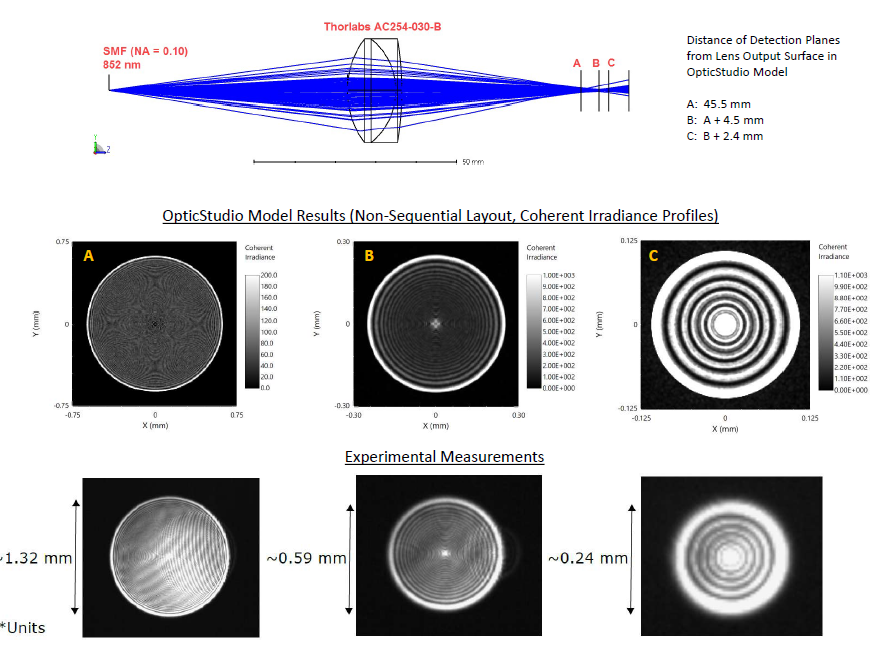
profile obtained using Zemax not matching with what we see in the laboratory. 

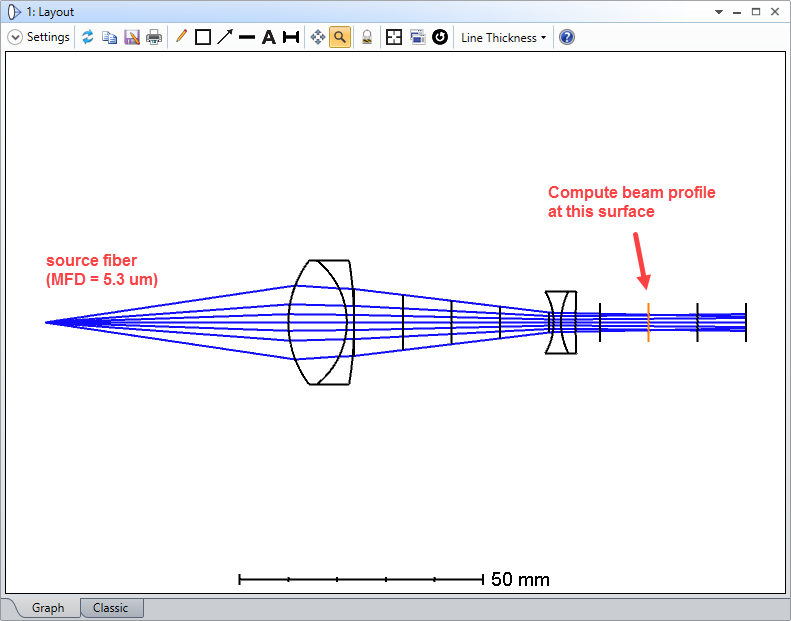
The setup is very simple: light exits a fiber (with mode field diameter ~ 5.3 mu-m) and passes through two lenses -- with focal lengths +30 mm and -20 mm (the intention is to test beam-size reduction). [This tutorial was adapted to follow the beam’s path in the ‘Cross-section’ window: Single-mode fiber coupling in OpticStudio – Knowledgebase (zemax.com)]

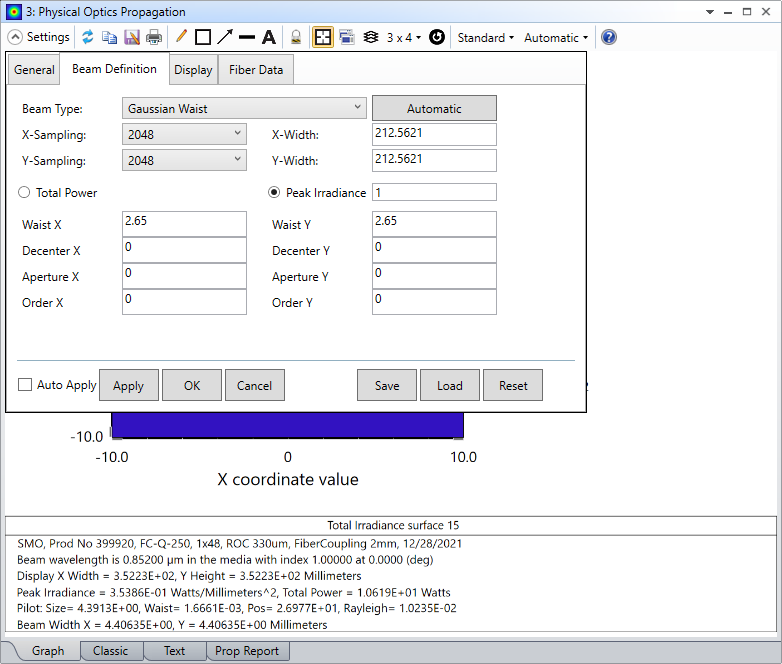
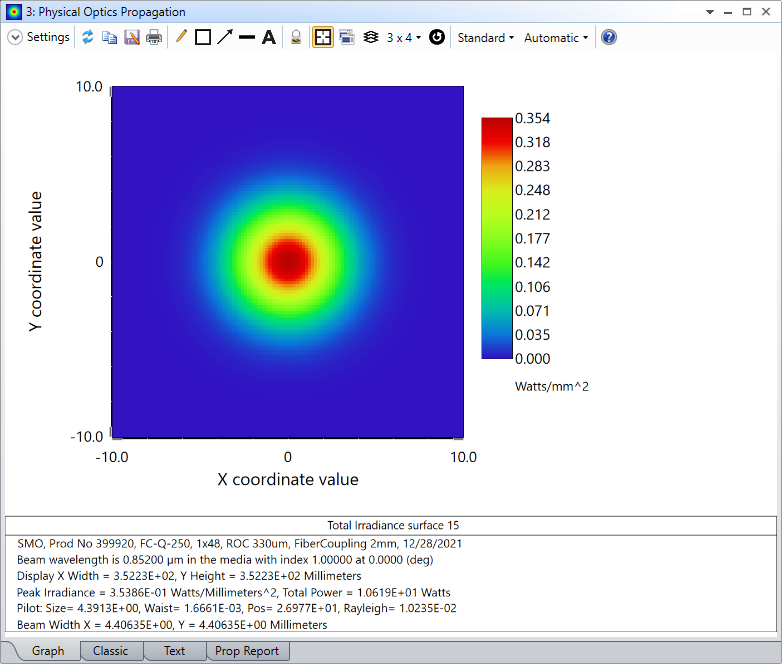
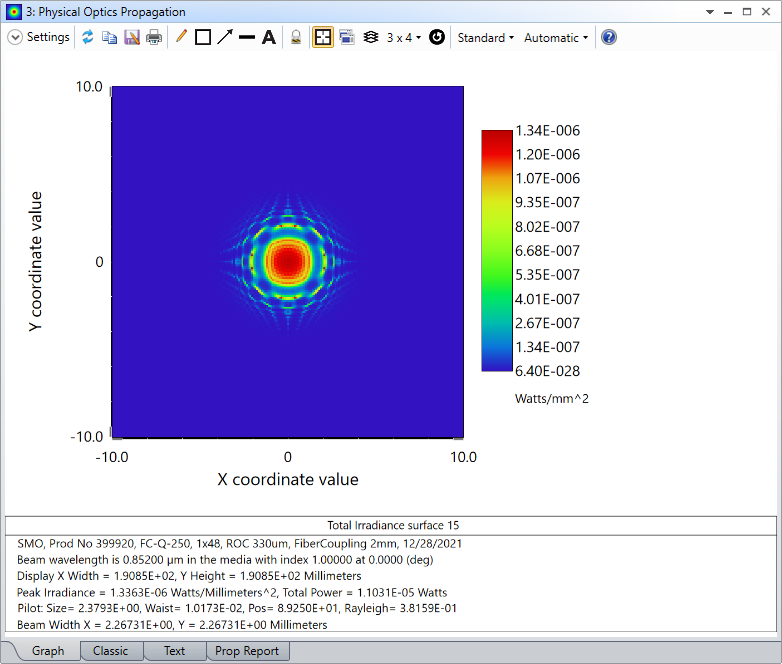
Experimentally, the field profile after the second lens (-20 mm) is perhaps spherically aberrated and is circularly symmetric. It doesn’t quite seem to match the output of the POP (Physical Optics Propagation) module in Zemax. A .png file showing the disparity and the .zmx/.zar files are attached in the .zip file below. 

Thanks a lot for your time, 
Sai


11 replies

Userlevel 7
Badge +3

I took a look at your model and don’t see anything particularly unusual with the POP results.  First, I modified the aperture to have an  object space NA of 0.15, but that doesn’t make any difference in this particular case (just shows a somewhat more accurate version of the beam on the layout).

Then set up and run POP to look at the beam 15 mm after the second lens.

The beam profile looks like it remains very Gaussian.

However,  I note the comment on the source fiber surface says HCF_Output.  Is this a hollow-core fiber?  If so, it may not be accurately modeled by a simple Gaussian.


Thanks a lot for the response!
 
i) In the POP settings window you shared, are the units correctly taken? I think the Lens Units are in ‘mm’; so the waist should be 2.65 mu-m = 0.00265 mm, correct?

ii) My apologies for the comment. Although the note tags it as ‘HCF Output’, the experiment used an SMF. The intention for the lens design was for a hollow-core fiber. 


Userlevel 7
Badge +3

Oops, my bad (silly mistake...).  Now I see a profile similar to yours.

Have you looked at the sensitivity to the spacing between lenses?  Does your model match the experimental setup with the required accuracy?

Thanks again for the response and your time, Sir.

I shall look into the the role of spacing between the lenses in Zemax -- but I don’t seem to have observed a reasonable match and also, am unsure of how high a resolution we can get in POP’s output. Experimentally, if I recollect correctly, the circularly symmetric, ring-like features were quite independent of the distances b/w the lenses. 

Userlevel 7
Badge +3

There’s certainly quite a large discrepancy between the model and experiment.  The rings in your experimental results are reminiscent of diffraction from a hard aperture that is clipping the beam or some sort of etalon effect.  It would be interesting to see experimental pictures of the beam before and after the first lens.

Userlevel 7
Badge +3

Increasing the resolution to 8192 x 8192 yields a beam with less irradiance structure (and a less noisy phase profile):

When comparing to the experimental results, it would be helpful to have a spatial scale on the experimental images, as well as a fairly accurate location of where each image is taken along the optical path.

Hello Sir,

Tried testing how the beam looks like after the first lens. The attached PDFs contain the field profile comparisons. Might there be a way to check if output from Zemax might converge to some extent to the camera images? 


Userlevel 7
Badge +3

Ok, I think I have been able to simulate your beam profiles reasonably well.  First, after a more careful examination, I realized that the aberrations are simply too large for a wave optics, or POP, model to handle (the spatial phase variations with respect to the pilot beam reference wavefront are just too rapid to properly sample).  So, instead, I used a non-sequential model with coherent detection via a Detector Rectangle.  This mode of simulation generates the interference effects that are causing the ring patterns you observe in the lab.  To match your experimental results I had to adjust the locations of the detection planes.  Also, it looks like your images are saturated, which enhances the low-intensity portions of the beam.  I did the same thing in the model by adjusting the maximum scale on the detector images.  A summary of the results (for one lens orientation) is attached, along with a copy of the model file.  Hope this helps...


Userlevel 7
Badge +3

One more quick note.  The rings are a manifestation of spherical aberration.  In a well-corrected lens system (e.g., one using aspheres), the rings would not exist, and POP would work much better.

This is very helpful, Sir! Thanks a lot for your time!

I shall go through the shared files -- it appears that might well resolve the issue :). 

One last question -- Other ways of quantifying these aberrations in Zemax (such as Seidel coefficients) might also be able to validate the same, I presume?

Userlevel 7
Badge +3

Yes, there are a range of aberration analysis tools available in sequential mode.  Perhaps the simplest and most common one being a spot diagram with the Airy disk displayed -- if all of the rays land within the Airy disk, then the design is approaching the diffraction limit (the closer to the center the better).  Then there are other tools such as ray fans, OPD fans, Seidel coefficients, PSF, MTF, etc.  Your current design is on-axis, so spherical aberration is the primary culprit.

Reply